With the market’s uncertainty pushing a majority of stocks to levels at or near their historical lows, finding a big winner in the last year has been a rare thing.
One of the pockets of the market that has been more resilient over the last few months is the Energy sector. High demand has kept oil prices well above their 2021 levels, and that’s been a positive things for a lot of Energy-related stocks. While the now yearlong war in Ukraine continues to be a disruptive factor on both the geopolitical, economic front, and tragic on a humanitarian level, it has also kept oil and natural gas demand high for other producers, from the Middle East to North America. That can help explain, at least in part why a lot of Energy stocks have not only weathered the storm of the last year better than other sectors, but also been among the market’s star performers. All across the energy supply chain, from explorers and drillers to transportation and storage, as well as the companies that provides equipment and services, higher energy prices have provided a boost to bottom lines as well as stock prices.
Schlumberger N.V. (SLB) is one of the largest companies in the world in the Energy Equipment & Services industry. After falling to a July 2022 low at around $30.50, the stock has staged an impressive upward trend that saw its most recent peak at around $59, and more than 80% above that yearly low. The rally has been aided by SLB’s fundamental profile, which reflects declining long-term debt, good liquidity and improving operating margins over the past year that could be a strong indication it’s in a good position for whatever might be ahead. Is that good enough to make a case for SLB as a tempting value prospect, or has the stock passed the point of useful value? Let’s take a look.
Fundamental and Value Profile
Schlumberger N.V. provides technology for reservoir characterization, drilling, production and processing to the oil and gas industry. The Company’s segments include Reservoir Characterization Group, Drilling Group, Production Group and Cameron Group. The Reservoir Characterization Group consists of the principal technologies involved in finding and defining hydrocarbon resources. The Drilling Group consists of the principal technologies involved in the drilling and positioning of oil and gas wells. The Production Group consists of the principal technologies involved in the lifetime production of oil and gas reservoirs and includes Well Services, Completions, Artificial Lift, Integrated Production Services (IPS) and Schlumberger Production Management (SPM). The Cameron Group consists of the principal technologies involved in pressure and flow control for drilling and intervention rigs, oil and gas wells and production facilities. SLB has a current market cap of $80.1 billion.
Earnings and Sales Growth: Over the last twelve months, earnings increased 73%, while sales were about 26.5% higher. In the last quarter, earnings improved by 12.7% while sales grew by 5.38%. SLB’s operating profile matches its earnings pattern; Net Income versus Revenue over the last year was 12.25%, and strengthened in the last quarter to 13.52%. This metric was soundly negative in 2020, but has shifted over the last two years to healthy levels, which I take as a strong indication the company has successfully navigated its way through the worst effects of the last three years.
Free Cash Flow: SLB’s Free Cash Flow is generally healthy, at almost $2.7 billion over the last twelve months. That represents a decline from $3.5 billion a year ago, but did increase from $2.2 billion in the quarter prior. The current number translates to a Free Cash Flow Yield of 3.34%.
Debt to Equity: SLB has a debt/equity ratio of .59, a conservative number that signals a conservative approach to leverage. Cash and liquid assets in the last quarter were about $2.9 billion versus about $10.6 billion in long-term debt. it is worth mentioning that a year ago, long-term was more than $13.1 billion. The company’s operating profile suggest the company should have no problem servicing its debt.
Dividend: SLB pays an annual dividend of $1.00 per share, which at its current price translates to a dividend yield of about 1.78%. After slashing the dividend during the pandemic to about $.50 per share to start 2022, management has increased the dividend twice over the last year, including the most recent increase after their last earnings announcement to its current level.
Price/Book Ratio: there are a lot of ways to measure how much a stock should be worth; but I like to worth with a combination of Price/Book and Price/Cash Flow analysis. Together, these measurements provide a long-term target at almost $26.50 per share. That means the stock is overvalued, with about -10% downside from the stock’s current price, and a useful discount at around $21. It is also worth noting that a few months ago, this same analysis yielded a fair value target at around $23.50.
Technical Profile
Here’s a look at the stock’s latest technical chart.
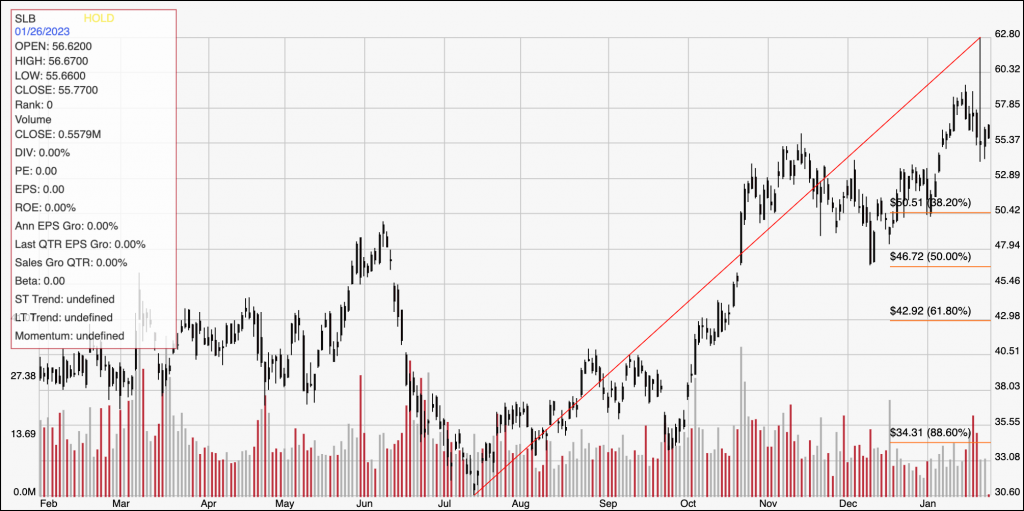
Current Price Action/Trends and Pivots: The chart above displays the last year of price activity, with the diagonal red line tracing the stock’s rally from about $30.50 in July 2022 to a peak at around $59 earlier this month. It also provides the baseline for the Fibonacci retracement lines shown on the right side of the chart. The stock has faded off of that high point, and has found current support at around $55. A drop below $55 should find next support around $53, while a push above $59 could see the stock rally to $59 in the short-term, and about $63 if buying pressure increases.
Near-term Keys: There really isn’t any way to suggest that SLB’s value proposition right now is useful, even with the company’s generally healthy fundamental profile that is highlighted by improving operating margins and increasing dividend. That means that the best probabilities to work with this stock lie with short-term trading strategies; if the stock drops below $55, consider shorting the stock or buying put options, using $53 as a practical, quick-hit profit target. A rally and break above $59 could offer an interesting signal to buy the stock or work with call options, using the stock’s last peak at $59 providing a useful, quick-hit profit target on a bullish trade and $63 if bullish momentum increases.