AT&T Inc. isn’t just one of the largest telecomm companies in the United States, but also one of the most established and recognized names in the world.
From its origins as “the phone company” to its expansion into wireless telecommunications, broadcast media and even the film industry, this is a company that has almost certainty had a place in your daily life. T’s 2018 acquisition of Time Warner gave it a foothold in the film industry occupied by media companies like Viacom and Disney that many quickly began to criticize as an overextension of the company’s capability, but that they argued was necessary to keep up with its media competitors and also against streaming media services like Netflix, Amazon Prime, and so on.
Multiple difficulties associated with Time Warner in the years following the acquisition finally let to the company’s decision to spin off the WarnerMedia unit into a new company merged with Discovery. The spinoff and merger was completed in 2022, a move that gives the Warner side freedom to operate more freely than it could under the AT&T umbrella, and AT&T the ability to turn its focus back on its core strengths in the telecommunications industry.
A more streamlined focus by the company’s management also means that analyzing the company, and therefore also the stock becomes a little more straightforward as well because it puts the focus back on the company’s telecommunications business. T’s wireless and telecomm businesses have lagged behind competitors, especially in the ever-important 5G world, and has been a primary focus of capital expenditures and development over the past year. Another residual effect of the spinoff is that the company cut its dividend, and in the process gave up its long-standing place among the Dividend Aristocrat elite (companies that have increased their dividend payouts for at least 25 consecutive years). Some analysts suggest that the dividend cut will chase income hunters away from the stock, and I suppose that makes some sense given the size of the dividend payout prior to the spinoff; but I think it is also useful to note that, at the stock’s current price, its $1.11 dividend still offers a very interesting annualized yield of 5.47%. That remains well above the S&P 500 average, and still far above the rates offered by long-term Treasury bonds even as interest rates are rising.
It’s also worth taking the time to look a little deeper; after all, with the Warner Media segment now off the books, the company’s fundamental profile has changed. Critics of the deal point to the fact that T still owns a large portion of the debt it assumed to make the acquisition four years ago, and even with the roughly $40 billion in cash it received to complete the merger with Discovery, that debt remains sizable. The real question, of course is how the company’s other fundamentals have shifted. Prior to the completion of the acquisition, my own analysis suggested that AT&T was nicely undervalued. Is the same true now? Let’s find out.
Fundamental and Value Profile
AT&T Inc. is a holding company. The Company is a provider of telecommunications, media and technology services globally. The Company operates through three segments: Communication segment, WarnerMedia segment, and Latin America segment. The Communications segment provides wireless and wireline telecom, video and broadband services to consumers. The business units of the Communication segment includes Mobility, Business Wireline and Consumer Wireline. The WarnerMedia segment develops, produces and distributes feature films, television, gaming and other content over various physical and digital formats. WarnerMedia segment also includes Xandr, which provides advertising services. Latin America segment provides entertainment and wireless services outside of the United States. Mexico is the business unit of the Latin America segment, which provides wireless service and equipment to customers in Mexico. T has a current market cap of about $141.7 billion.
Earnings and Sales Growth: Over the last twelve months, earnings declined by about -22%, while revenues declined by about -23.5%. In the last quarter, earnings were -10.3% lower, while revenues increased by 4.33%. T operates with an operating profile that currently reflects their active investment in playing catch-up in the 5G space. Over the last twelve months, Net Income was -7.06% of revenues, and accelerated to -75% in the last quarter. This is an alarming shift from positive trends in both cases as late as the start of the fourth quarter of last year.
Free Cash Flow: T’s free cash flow is healthy, at a little over $16.1 billion. This number has increased steadily since early 2015, from about $10 billion, but is lower over the past year, from $20.5 billion. The current number translates to a useful Free Cash Flow Yield of 11.2%.
Dividend: T’s annual divided is $1.11 per share, which translates to a very attractive yield of 5.47% at the stock’s current price.
Debt/Equity: T carries a Debt/Equity ratio of 1.21. Their balance sheet shows $3.7 billion in cash and liquid assets, up from $2.4 billion in the quarter prior and $38.565 billion prior to the spinoff a year ago. The company also has against $128.4 billion in long-term debt (compared to $122.3 billion in the quarter prior and $180.225 billion pre-spinoff). As with other companies in this industry, T has also historically carried a lot of debt, with more than $100 million in long-term debt on the books since mid-2015. T’s still-healthy Free Cash Flow, however the shift to negative Net Income raises legitimate concerns.
Price/Book Ratio: there are a lot of ways to measure how much a stock should be worth; but I like to work with a combination of Price/Book and Price/Cash Flow analysis. Together, these measurements provide a long-term, fair value target at about $14.75 per share. That suggests that the stock is very overvalued, with -27% downside from its current price, and a practical discount price at around $12. It is also worth noting that in the last quarter, this same analysis yielded a fair value target price at $18.50 per share.
Technical Profile
Here’s a look at the stock’s latest technical chart.
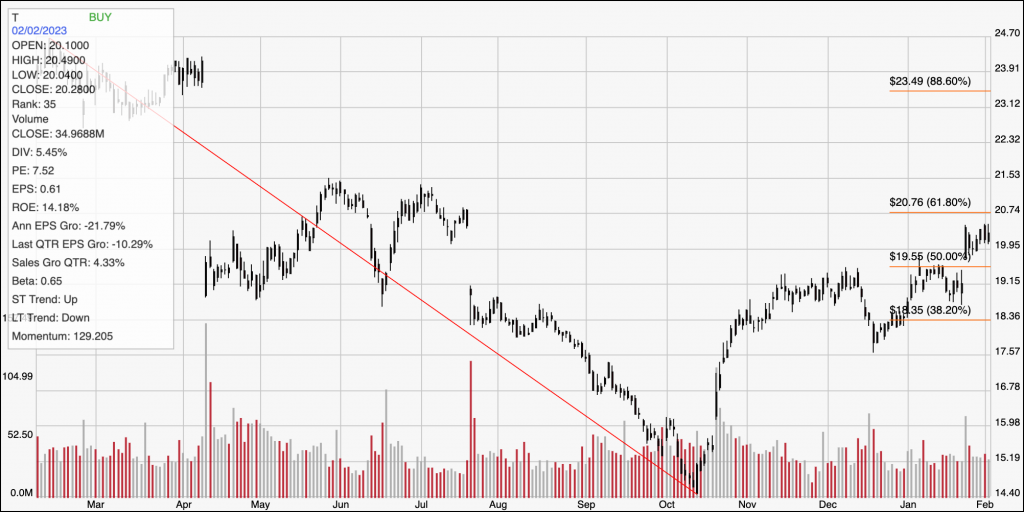
Current Price Action/Trends and Pivots: The red diagonal line measures the length of the stock’s downward trend from its peak a year ago at around $25 to its low, reached in October at around $14.50; it also provides the baselines for the Fibonacci trend retracement lines shown on the right side of the chart. The stock has rallied strongly off of that low, and is now approaching immediate resistance at around $21, where the 61.8% is waiting. Current support should be back at around $19.50, inline with the 50% retracement line and where pivot high activity occurred earlier this month and in the last two months of 2022. A push above $21 should have upside to about $23, while a drop below $19.50 should find next support at around $18, around the 38.2% retracement line.
Near-term Keys: T offers a high dividend that makes for tempting bait for income-seeking investors. The market is current giving the stock a nice bullish lift, that unfortunately isn’t supported by the latest set of financial data. T’s Net Income should raise red flags for any serious long-term, value-focused investor, despite the fact Cash has improved and Free Cash Flow remains healthy. If you prefer to focus on short-term trading strategies, the best signal to consider buying the stock or working with call options would come from a push above $21, with upside to around $23. A drop below $19.50 could be used to consider shorting the stock or buying put options, so long as you plan to take profits quickly once the stock begins to approach $18.