One of the core principles about technical analysis that was drilled into my head early in my investing career is that “the market is always right.”
It’s one of those idioms that is good as sound bite. It’s also useful in building a disciplined investing mindset, because it’s designed to disconnect a person’s bias about a company from the investing decision and instead to learn to rely on the stock’s price action to drive a more objective approach to trade timing as well as what kind of trade to make – buy, sell, or stay away.
Early in my investing career, I put a lot of focus on understanding technical concepts like identifying short-term reversal points as support and resistance, trend formations over time, and how all of that information can be applied against a stock’s current price to recognize signals about a stock’s likely direction across multiple time periods in the future. Those principles put “the market is always right” into a clearer context and made it easier to separate whether or not I liked the company or their core business from a practical investing decision.
For some, the mindset I just outlined tends to dismiss the value argument, which relies on the company’s underlying fundamental strength to drive an evaluation about what the stock should be worth. Pure technicians operate on the basis that the market prices in all available information about a company into its stock at all times, no matter whether that information is qualitative, quantitative or otherwise. That means that whatever a stock’s price is today, that is where it probably should be. It’s why swing and momentum traders don’t care so much about what a stock’s price is right now as much as which way it’s going, and what that direction might say about where it is likely to go next.
In the years since I cut my teeth on those technical concepts, I’ve studied and learned more about fundamental and value-based principles. Along the way, I’ve learned to combine the best of both the technical and fundamental viewpoints into the system I use now. Understanding where a stock is right now in relation to its trends helps to shape my viewpoint about the probabilities of also identifying stocks at useful valuation levels. Sometimes, those principles work well in concert with each other and at other times they seem diametrically opposed. The longer a bull market lasts, for example, the harder it gets to find stocks with the ideal combination of a value and fundamental-driven discount with a trend that leads me to also believe potential downside could be limited.
The Financial sector is a good example of what I mean. From early in 2020 until the beginning of 2022, the sector was one of the biggest stars of the market. As interest rates have increased this year, however, the opposite has held true, as the sector dropped nearly -30% from its January high to its October low as measured by the U.S. Financials iShares ETF (IYF). From that point, however, the sector has picked up positive momentum that has pushed a lot of financial stocks higher.
In the Financial sector one of the companies that I like to pay attention to is U.S. Bancorp (USB). While this company will usually not get mentioned on news media when talking heads start talking about the largest banking institutions in the U.S., it is the 6th largest bank in the U.S. by deposits. They boast a very healthy balance sheet with liquid reserves well in access of debt obligations and a healthy dividend that makes tempting fodder for income-seeking investors. From its own October 2022 low, the stock has rebounded by nearly 28%, establishing a useful upward trend that now sees the stock hovering at around $49 per share. That’s good growth-focused investors, but what about the value proposition? Has the stock outpaced its fundamental strength, or could there still be room to offer an attractive value-driven opportunity? Let’s find out.
Fundamental and Value Profile
U.S. Bancorp is a financial services holding company. The Company provides a range of financial services, including lending and depository services, cash management, capital markets, and trust and investment management services. It also engages in credit card services, merchant and automated teller machine (ATM) processing, mortgage banking, insurance, brokerage and leasing. Its banking subsidiary, U.S. Bank National Association, is engaged in the general banking business and offers commercial and consumer lending, lending services, depository services and ancillary services. Its non-banking subsidiaries offer investment and insurance products to the Company’s customers principally within its domestic markets, and fund administration services to a range of mutual and other funds. The Company’s bank and trust subsidiaries provide a range of asset management and fiduciary services for individuals, estates, foundations, business corporations and charitable organizations. USB’s market cap is about $74.7 billion.
Earnings and Sales Growth: Over the last twelve months, earnings increased by 12.15%, while sales were a little more than 36% higher. In the last quarter, earnings growth was a bit muted, at 1.69% while sales were about 11.4% higher. USB’s margin profile is very healthy, but is showing some signs of weakness; Net Income as a percentage of Revenues was 21.26% over the last twelve months, and dropped in the last quarter to 11.54%.
Free Cash Flow: USB’s free cash flow was nearly $15 billion over the past twelve months and translates to a Free Cash Flow Yield of 20.46%. It has also increased over the past year, from $9.87 billion at the end of 2021.
Dividend Yield: USB’s dividend is $1.92 per share, and translates to yield of 3.91% at its current price. It has also increased from $1.68 per share in the first quarter of 2021, which further confirms the company’s overall fundamental strength.
Debt to Equity: USB has a debt/equity ratio of .9. This is a manageable number. Their balance sheet shows $53.5 billion in cash and liquid assets against about $39.8 billion in long-term debt. It should be noted that will cash increased by nearly $12 billion in the last quarter, long-term debt also increased by about $7.9 billion. Despite the increase in debt, the company is in an excellent financial position with very high liquidity.
Price/Book Ratio: there are a lot of ways to measure how much a stock should be worth; but I like to work with a combination of Price/Book and Price/Cash Flow analysis. Together, these measurements provide a long-term, fair value target at around $60 per share. That means the stock is nicely undervalued, with about 22% upside from the stock’s current price.
Technical Profile
Here’s a look at the stock’s latest technical chart.
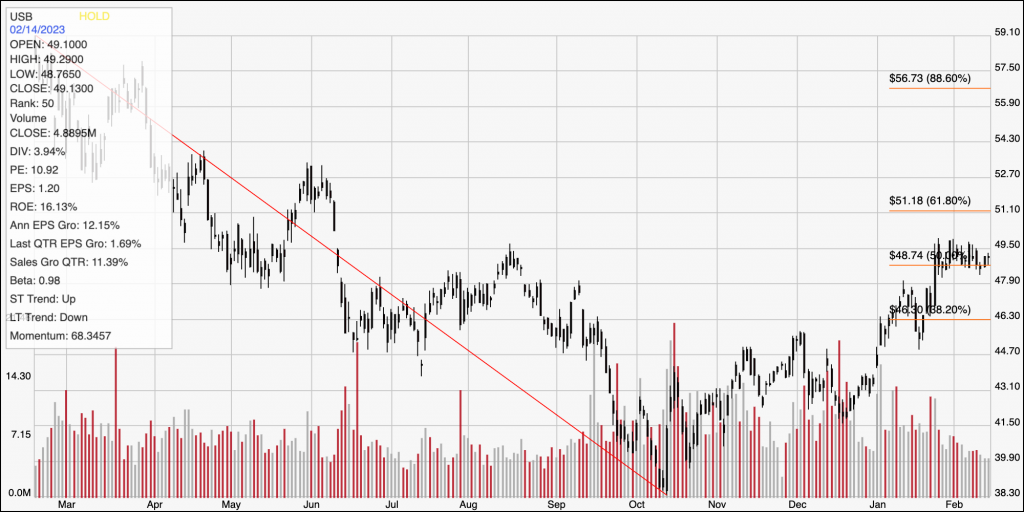
Current Price Action/Trends and Pivots: This chart traces the stock’s movement over the last year. The diagonal red line traces the stock’s downward trend over the past year, from a high at around $59 to an October low at about $38. It also provides the baseline for the Fibonacci retracement lines shown on the right side of the chart. Since October of last year, the stock has moved into an intermediate upward trend, with current support at around $48 per share, and immediate resistance at around $50. A push above $50 should see next resistance at $51, however an increase in buying activity could push the stock to its next resistance level, which should be at around $53 based on pivot activity seen in April and May of last year. A drop below $48 could see the stock fall to about $45, with additional room to about $43 as next support if selling momentum accelerates.
Near-term Keys: USB offers a useful value-based opportunity, however an environment of increasing interest rates should be expected to limit upside on the stock price, meaning that taking the stock as a new investing opportunity should be considered a long-term proposition. If you prefer to focus on short-term trading strategies, a push above $51 could provide an interesting signal to buy the stock or work with call options, with $53 providing a practical bullish profit target. A drop below $48 could be a signal to short the stock or buy put options, using $45 as a practical, initial profit target, and $43 if bearish sentiment strengthens.