When everybody is buying, contrarian and value-focused investors tend to get more cautious.
The opposite is also true – when everybody is running for the exits, we start finding more and more attractive opportunities at great prices.
The past year has been rough for just about every investing strategy, no matter whether you focus on growth or value. The past week has been a good example as new economic data suggests that rising interest rates haven’t been as successful as some in the market have hoped, implying that rates might need to keep rising rather than plateauing this year. That means that pressure on a lot of stocks should remain relatively high.
The truth is that just because a stock may have already dropped significantly off of a previous high, it really says nothing about whether it will continue to fall or when it will reverse. That’s also one of the reasons that contrarians and value investors like myself spend a lot of time thinking about how much a stock should be worth. We have to measure whether the long-term opportunity is great enough to justify the real possibility of buying and holding a stock through a continued, potentially longer-term downward trend.
One area that has been resilient, but certainly not immune to broader pressures for most of the last three years is the Food Products industry. For most of 2021, stocks in this industry not only kept pace with the market, but in many cases outperformed the sexier, growth-driven industries and names. Diving into the fundamentals of many of these companies today, in many cases shows balance sheets that continue to weather the storm, first from the pandemic and now from increasing inflationary indicators better than most other industries. That increasing fundamental strength was a big driver in stock price performance in 2020 and 2021. Since that outperformance, however, a lot of the luster has come off of those stocks.
In the Food Products industry, inflationary indicators have begun rippling into consumer prices, and for many companies, showing a clear impact on operating margins. With interest rates expected to continue rising through the rest of this year, this looks like a headwind that is unlikely to be resolved any time soon. That means that while the Food Products industry is likely to continue to see healthy demand, whether supply can rise to meet that demand remains an open question.
Tyson Foods Inc. (TSN), is a company I’ve followed for some time. 2020 wasn’t good for the stock; from a peak at around $94 to start that year, the stock began a downward slide that only accelerated as the global coronavirus pandemic took the stock market into bear market territory. TSN did find a bottom at around $44 with the rest of the market, and by the end of 2020, the stock was sitting at around $62.50. 2021 saw the stock extend its long-term upward trend even more, hitting a 52-week high in February of 2022 at around $100. From that point, however, the stock moved into a clear downward trend that bottomed in late December of last year, and from which the stock has struggled to find any kind of significant bullish momentum. While that’s not great for growth investors, creating a bottom-end consolidation range also begins to look interesting for bargain hunters.
Beyond the pandemic, the company has experienced a useful tailwind over the past couple of years, and including 2022 in the form of global increases in protein demand, helped in part of pork shortages in Asia that are expected to persist following the African Swine Flu epidemic that has ravaged that region’s hog population for most of the past five years. Even so, inflationary pressures, including rising input costs are something the company is dealing with, like just about every other company in the Food Products industry. They are also investing heavily to expand production capacity on a global scale while also modernizing domestic production in the U.S. in an effort to manage expenses. The question now, of course is whether the company’s fundamentals have weathered those latest pressures, so that the stock’s drop in price (more than -40% from its February peak as of this writing) puts it in a useful value-based position? Let’s find out.
Fundamental and Value Profile
Tyson Foods, Inc. is a food company, which is engaged in offering chicken, beef and pork, as well as prepared foods. The Company offers food products under Tyson, Jimmy Dean, Hillshire Farm, Sara Lee, Ball Park, Wright, Aidells and State Fair brands. The Company operates through four segments: Chicken, Beef, Pork and Prepared Foods. It operates a vertically integrated chicken production process, which consists of breeding stock, contract growers, feed production, processing, further-processing, marketing and transportation of chicken and related allied products, including animal and pet food ingredients. Through its subsidiary, Cobb-Vantress, Inc. (Cobb), the Company is engaged in supplying poultry breeding stock across the world. It produces a range of fresh, frozen and refrigerated food products. Its products are marketed and sold by its sales staff to grocery retailers, grocery wholesalers, meat distributors, warehouse club stores and military commissaries, among others. TSN has a current market cap of $21.7 billion.
Earnings and Sales Growth: Over the last twelve months, earnings declined more than -70%, while sales increased 2.53%. In the last quarter, earnings were almost -48% lower while sales also slipped by about -3.5%. TSN traditionally operates with a modest margin profile; in the last twelve months, Net Income was 4.54% of Revenues, but weakened to 2.38% in the last quarter.
Free Cash Flow: TSN’s Free Cash Flow fell into negative territory in the last quarter, at -$51 million. That also marks a sustained decline from about $2.2 billion a year ago, and $800 million in the quarter prior. The drop to negative territory is a significant concern and confirmation of cost pressures the company is dealing with.
Debt to Equity: TSN has a debt/equity ratio of .40, which is conservative. Cash and liquid assets were about $437 million at the end of 2019, increased to $2.4 billion at the end of 2020, and fell to $654 billion in the last quarter. TSN carries about $7.8 billion in long-term debt. The company’s operating profile indicates debt service is still manageable, however the latest declines in cash, along with the drop to negative free cash flow, combined with deteriorating Net Income are significant warning signs.
Dividend: TSN increased its annual dividend from $1.68 per share to $1.78 per share in 2020, to $1.84 per share in 2021, and to $1.92 per share before the end of last year. The current number translates to a dividend yield of 3.08% at the stock’s current price. TSN’s dividend has also increased from $1.20 per share in late 2018, and $1.52 at the end of 2019.
Price/Book Ratio: there are a lot of ways to measure how much a stock should be worth; but I like to work with a combination of Price/Book and Price/Cash Flow analysis. Together, these measurements provide a long-term, fair value target around $67 per share. That suggests that the stock is undervalued, with 9% upside from its current price, and a practical discount price at around $54. It should also be noted that in the middle of last year, this same analysis yielded a long-term target at around $89.50 per share and $81 before the end of the fourth quarter.
Technical Profile
Here’s a look at the stock’s latest technical chart.
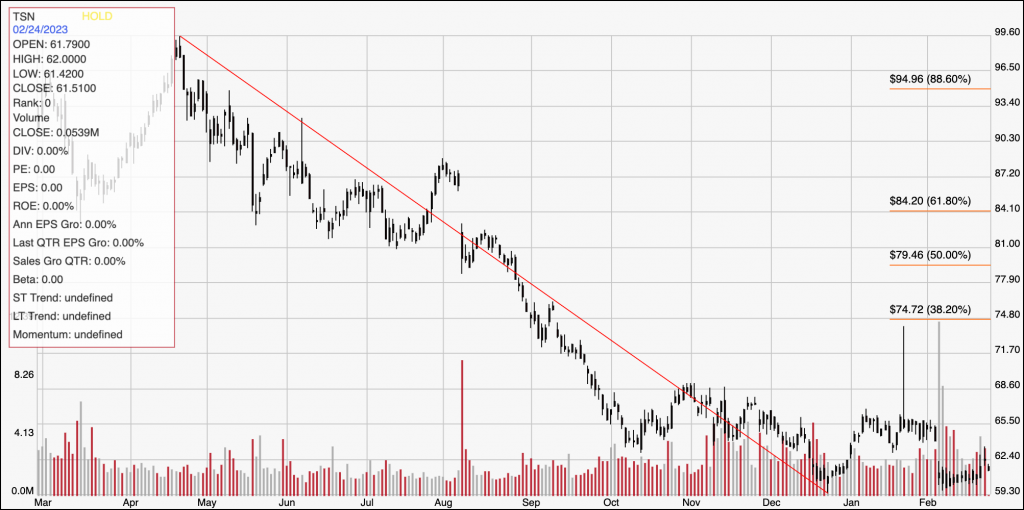
Current Price Action/Trends and Pivots: The diagonal red line outlines the stock’s downward trend from its April peak at around $100 to its December low at around $59. It also provides the baseline for the Fibonacci retracement lines shown on the right side of the chart. Since that low point, the stock has settled into a consolidation range, with $59 acting as current support and $63 providing immediate resistance. A push above $63 could see near-term upside to about $65.50 before finding next resistance, with $68.50 possible if buying activity increases. A drop below $59 would set a new 52-week low, with next support expected at around $55, using the stock’s current distance between support and resistance as a benchmark.
Near-term Keys: TSN’s current downward trend has pushed the stock into clear bear market territory, making the stock look like a possible contrarian play. I do think that the latest declines in Net Income, Cash, and Free Cash Flow (with particular emphasis on the drop to negative Free Cash Flow) are significant enough to suggest that the smarter approach right now is to wait for these numbers to see signs of improvement before thinking about TSN as a useful long-term bargain. If you prefer to work with short-term term trading strategies, you could use a push above $63 as a signal to buy the stock or work with call options, with a useful, initial profit target at around $65.50, and $68.50 if bullish momentum accelerates. A drop below $59 could offer a signal to consider shorting the stock or buying put options, using $55 as a practical profit target on a bearish trade.