One of the primary criteria I’ve learned to use to filter through the thousands of publicly traded companies in the stock market is the payment of dividends.
Dividends are a useful, relatively quick-reference approach to finding stocks with superior fundamentals than what most average investors pay attention to. Over time, they’ve also become more than just a starting point for my decision-making process. Conclusions can be drawn about a company’s dividend quality based on factors like how long they’ve been paying a dividend, what portion of their annual earnings per share is directed to dividend distributions, and whether management has maintained, increased, or decreased the dividend over time. I think these are excellent reflections of management’s commitment to return value to a company’s shareholders. Less important in my book, but important to others, is the size of the dividend.
It’s tempting to look for stocks that pay the highest dividends possible. I’ve learned to leaven my view of a dividend’s size against the larger backdrop of additional fundamental metrics. If free cash flow is healthy and growing, with improving profit margins, and a strong balance sheet, an attractive dividend is really just the cherry on top of my investing sundae. If a company offers a high dividend without those other items in place, the sustainability of the dividend should be called into question, and in like manner the overall fundamental strength of the company as well.
Coterra Energy Co (CTRA) is an independent oil and gas company, with its primary operations focused in the Marcellus Shale (Pennsylvani), Permian Basin (Texas/New Mexico), and Anadarko Basin (Oklahoma) regions of the United States. That means the company’s fortunes are heavily tied to the ebb and flow of light crude, the primary benchmark for U.S. oil and energy futures prices. Declining prices since June of last year in this commodity are a primary reason the stock has been following its own downward trend over the same period, falling from a 52-week high at around $36.50 to its current price a little above $25. This is a stock that should immediately be attractive for dividend hunters, since its payout translates to an annualized yield just a little below 10% right now. The size of the dividend begs the question: are the company’s critical fundamental metrics in place to sustain its high dividend? Just as importantly, does the stock’s current price, contrasted against those fundamental metrics, also translate to useful value? Let’s find out.
Fundamental and Value Profile
Coterra Energy Inc. is an independent oil and gas company, which is engaged in the development, exploration and production of oil, natural gas and natural gas liquids (NGLs). The Company’s assets are concentrated in areas with hydrocarbon resources. The Company’s operations are primarily concentrated in three operating areas: the Marcellus Shale in northeast Pennsylvania, the Permian Basin in west Texas and southeast New Mexico, and the Anadarko Basin in the Mid-Continent region in Oklahoma. Its Marcellus Shale properties are principally located in Susquehanna County, Pennsylvania, where the Company holds approximately 177,000 net acres in the dry gas window in the Marcellus Shale. Its Permian Basin properties are principally located in the western half of the Permian Basin, where it holds approximately 306,000 net acres in the play. Its Anadarko Basin properties are principally located in Oklahoma, where it holds approximately 182,000 net acres in the play. CTRA has a market cap of $20 billion.
Earnings and Sales Growth: Over the last twelve months, earnings for CTRA increased by 44.3%, while sales increased about 2.5%. In the last quarter, earnings shrank by -18%, while sales declined by about -9.5%. The company’s operating profile is very healthy, as Net Income was 44.91% of Revenues over the last twelve months, and strengthened to 45.26% in the last quarter.
Free Cash Flow: CTRA’s free cash flow is healthy, at about $3.7 billion over the last twelve months. That number also marks an increase from $3.5 billion over the prior quarter, and $1.8 billion a year ago. The current number translates to an attractive Free Cash Flow Yield of 18.9%.
Debt to Equity: CTRA has a debt/equity ratio of .17. This is a conservative number that reflects a mostly conservative approach to leverage. The company’s balance sheet shows a little over $1 billion in cash and liquid assets in the last quarter versus about $2.2 billion in long-term debt. The company’s operating margins and increasing free cash flow are good indications that servicing their debt isn’t a problem.
Dividend: CTRA pays an annual dividend of $2.50 per share. At the stock’s current price, that translates to an outsized dividend yield of about 9.84%. The dividend payout is about 50% of the company’s trailing, twelve-month earnings per share, which along with the company’s additional fundamental strengths, suggests the dividend is sustainable.
Price/Book Ratio: there are a lot of ways to measure how much a stock should be worth; but I like to work with a combination of Price/Book and Price/Cash Flow analysis. Together, these measurements provide a long-term, fair value target a little above $45 per share. That means the stock is significantly undervalued, with about 77.5% upside from the stock’s current price.
Technical Profile
Here’s a look at CTRA’s latest technical chart.
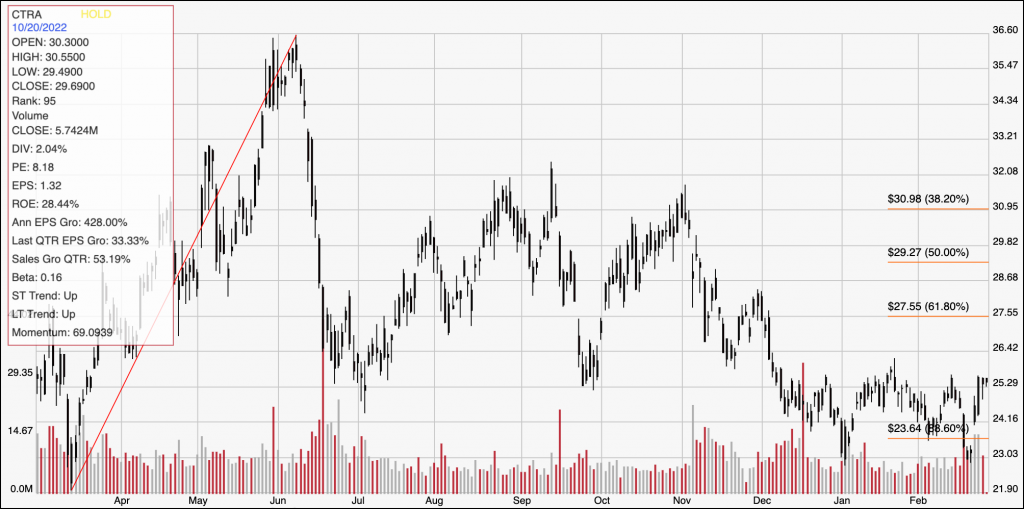
Current Price Action/Trends and Pivots: The chart above displays the last year of price activity for CTRA. The red diagonal line traces the stock’s upward trend in the early part of the year, from its 52-week low at around $22 to its June high at about $36.50. It also provides the baseline for the Fibonacci retracement lines shown on the right side of the chart. The stock has been consolidating since the beginning of the year, and is currently approaching immediate resistance from the top of that range at around $25.50. Current support is between $24 and $23.75 per share. A push above $25.50 should have short-term upside to about $27.50, where the 61.8% retracement line sits as next resistance. A drop below $23.75 has limited downside, to about $23 based on pivot lows to start 2023 and again a week or so ago, with secondary support sitting back at the stock’s 52-week low at around $22.
Near-term Keys: CTRA is a company with an impressive set of fundamentals that I think not only signal fundamental strength, but also validate the stock’s compelling value proposition. Current economic conditions do suggest that energy prices could remain under pressure, which implies the stock’s downward trend may not be finished. The fact that the stock is so far extending its consolidating range over a period of two months, and moving into a third is also a sign that the long-term downward trend for this stock could be ready to reverse. If you choose to use this stock as a useful long-term opportunity, you should also accept that additional downside risk is a real possibility in the nearer term. If you prefer to work with short-term trading strategies, a push above immediate resistance at $25.50 could be a good signal to consider buying the stock or working with call options, using $27.50 as a useful exit target. A drop below $23.75 has limited downside, which I think actually makes shorting the stock or buying put options a very low-probability prospect.