If there is one word that I think keeps the market on edge, it’s uncertainty.
Each year, it seems that analysts and pundits alike spend a significant amount of time trying to identify the driving elements of market and economic activity. 2022 saw a lot of newsworthy events from war to inflation and everything in between, and most of that has bled into 2023. After starting January strong, most of the major market indices have struggled to maintain their bullish momentum, and uncertainty on all of the already mentioned questions is the primary reason.
Economic uncertainty usually suggests that cyclically-sensitive industries are the most exposed to downside risk. One of the industries that certainly fits that general description is the Auto industry. As measured by the Nasdaq Global Auto Index ETF (CARZ), this is an industry that dropped more than -42% from its 2021 high to a low in October of last year. The decline was exacerbated by supply chain challenges, increasing fuel prices that started in late 2021, and were compounded by the Russia-Ukraine war. Rising interest rates to head off accelerating inflation were hoped by some investors to flatten this year. However, continued inflationary economic indicators have shifted that opinion to the likelihood that the Fed will keep raising rates through this year. That adds to the mostly unspoken fear that continued high rates will plunge economic activity to recessionary levels, which should keep pressure in cyclically sensitive industries like Autos and Auto Companies high, making them more vulnerable than other industries and sectors right now.
MGA is a Canadian company whose biggest customers include the Detroit Big Three automakers and German brands Daimler, BMW and Volkswagen. And while they’ve taken their lumps with the rest of the industry and the market, their balance sheet has remained relatively resilient. They are also among the few companies in the industry that managed to maintain their dividend payout throughout the pandemic, and have even managed it to raise it. They also have enough of a presence in the electrical vehicle (EV) market to see positive impacts from that continued, emerging auto trend, with additional tailwinds from that part of their business expected to be a growth driver this year.
Over the past year, the stock has dropped back into a long-term downward trend that bottomed in October, and then was retested in January at around $45.50. The stock followed the rest of the market higher into the start of February, finding its latest peak at around $67.50 before dropping sharply back in the middle of the month. The stock appears to have stabilized since then at around $55 per share. The question, of course, is whether their overall fundamental strength, with that attractive dividend, and the stock’s current price action also make the stock a good value? Here are the numbers.
Fundamental and Value Profile
Magna International Inc. (Magna) is a mobility technology company. The Company’s segments include Body Exteriors & Structures, Power & Vision, Seating System and Complete Vehicles. Its product capabilities include body, chassis, exterior, seating, powertrain, active driver assistance, electronics, mirrors & lighting, mechatronics and roof systems. Its products include sealing systems, sliding folding and modular roofs, active aerodynamics, lightweight composites, fuel systems, engineered glass, body systems, electronic controllers, interior mirrors, exterior mirrors, tail lamps, small lighting, seat structures, door systems, power closure systems, mechanism & hardware solutions, foam & trim products, complete vehicle manufacturing, engineering services and fuel systems. MGA has a current market cap of about $15.9 billion.
Earnings and Sales Growth: Over the last twelve months, earnings dropped -30%; Revenues increased by a little over 5%. In the last quarter, earnings were -15% lower, while sales were 3.25% higher. MGA’s operating profile has historically been narrow, but is showing signs of weakness as inflationary questions have carried an impact. In the last quarter; Net Income versus Revenues was .99%, marking a modest improvement from 1.56% over the last twelve months.
Free Cash Flow: MGA’s free cash flow is modest, at $544 million. This number has declined over the last year, as shown by the fact Free Cash Flow was $846 million in the quarter prior and $1.15 billion a year ago. The current number translates to a Free Cash Flow Yield of about 3.39%.
Dividend: MGA pays an annual dividend of $1.84 per share, which translates to an annual yield of 3.28% at the stock’s current price. The company has also increased the dividend from $1.32 per share, per year steadily since late 2018, and includes an increase from $1.60 per share at the beginning of 2021 and $1.80 prior to the latest earnings announcement. An increasing dividend is an indication of management’s confidence in their business and long-term strategy.
Price/Book Ratio: there are a lot of ways to measure how much a stock should be worth; but I like to work with a combination of Price/Book and Price/Cash Flow analysis. Together, these measurements provide a long-term, fair value target around $25 per share. That suggests that MGA is overvalued by -55%, with a practical discount price at around $20. It is also worth nothing that in the first quarter of this year, this same analysis yielded a fair value target at around $64 per share, and $17 as recently as the last quarter.
Technical Profile
Here’s a look at the stock’s latest technical chart.
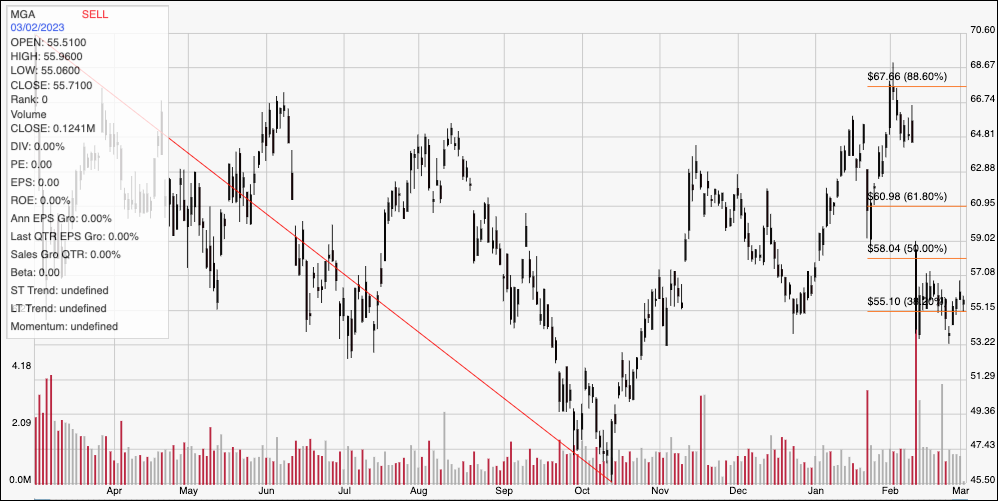
Current Price Action/Trends and Pivots: The chart above displays the stock’s price activity over the past year. The red diagonal line traces the stock’s downward trend from its peak at around $70.50 a year ago to its October low at around $45. It also provides the basis for the Fibonacci retracement lines on the right side of the chart. After staging a strong rally into the beginning of February, the stock peaked at around $67.50 and dropped quickly to the find new support, where it has been hovering since at around $55 where the 38.2% retracement line sits. Immediate resistance is at $57. A push above $57 should find next resistance at around $61, inline with the 61.8% retracement line, while a drop below $55 should find next support at around $53 based on previous pivot activity in that range. A drop below $53, however could see the stock drop to about $50 before finding additional support.
Near-term Keys: The stock’s current bearish momentum is a strong sign that any kind of short-term, bullish trade is speculative, with a very low probability of success. If you are looking for a useful momentum or swing-based trading opportunity, however, a drop below $55 would be a strong signal to consider shorting the stock or buying put options, with a useful initial target at about $53, and $50 possible if selling activity picks up again. From a value-based standpoint, there is no way under current conditions that the stock can be considered any kind of useful value. Best to tuck this one away in a watchlist and check back in a quarter or two to see if the company’s fundamentals, particularly Net Income and Free Cash Flow, have begun to improve.