Silicon Valley Bank experienced unprecedented growth from its tech startup clientele in 2020 and 2021, but was ultimately brought down by a one-two punch: their exclusive exposure to riskier investments combined with the regulations enacted post 2008. This forced them to heavily invest customers’ deposits into U.S Treasuries which created an unsustainable situation as volatile interest rates began to chip away at profits.
After the Federal Reserve had taken their rate-hiking campaign too far, U.S. Treasuries plummeted in value – and SVB was left with a huge pile of unrealized losses from its bond portfolio as early as 2023. Typically these losses were bearable given how customer deposits kept rising without needing to withdraw any cash; however when times got rough and need for liquid funds increased due to declining consumer confidence, the bank was forced into selling those bonds no matter what it cost them – resulting in a devastating “realized loss” for SVB.
As tech startups struggled to stay afloat during the past year, venture funding was essentially stopped. Unfortunately for SVB’s customers, they were still running businesses that required cash flow which meant money had to continue going out of their accounts – but with no new funds coming in. This created an untenable situation and forced SVB into selling off its bond portfolio at a multi-billion dollar loss. To cover these losses, outside capital was desperately sought through share offerings however none came; leading the federal government to eventually take over operations in order to keep things from sinking further.
This is why following price only in stock trading can be a good strategy because it eliminates any subjective judgment when making decisions on what stocks to buy. By relying solely on the price of a stock, rather than fundamentals such as company growth or analyst opinions, traders can make decisions based solely on market movements. This allows them to make fast and accurate decisions that have been proven to be profitable over time.
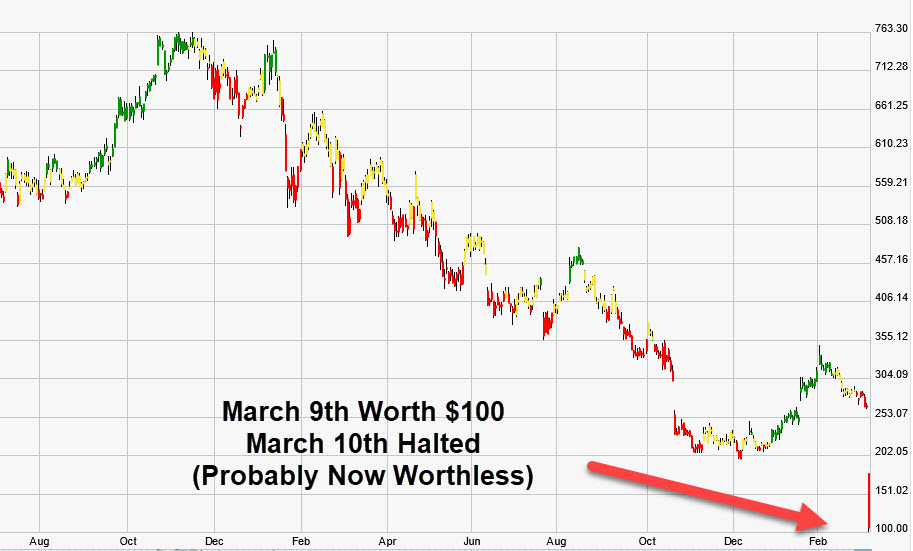
Price action on this stock chart started to decline at the beginning of 2022. You can see that there were only two or three times where it moved back into a new uptrend only to rollback over and continue the overall downward slide towards $100 as of March 9th 2023. As of March 10th the stock was halted and probably close to worthless.
Price activity shows all information that is known or anticipated (even by insiders) and that information is priced into the stock in real-time. For the entire year this stock was at the very least not noteworthy of investing in because of the significant downtrend. There were hundreds of better opportunities to invest in. Find out if you own any ticking time bomb stocks on this list.
Here are other news posts regarding the topic.
To learn more about how to invest in the best stocks at the best time no matter the market conditions. Click the learn more button below. Or Join me know in a short presentation starting in just minutes.