One of the things uncertainty in the markets does is to make investors hesitant about new buying opportunities, which makes some sense when it looks like the economy could be on the brink of a new recession.
Economic uncertainty is a big reason that defensive-oriented stocks have remained an important part of my investing focus, and that is why one of the sectors that I have been paying the most attention to for most of the past four years (even before COVID became a thing) has been Consumer Staples. I like a number of industries in this sector, like Food Products and Grocery stores, which represent businesses that consumers still have to engage with even when times are difficult. That includes the so-called “sin stocks” – companies like Molson Coors Brewing Company (TAP) that provide alcoholic beverages along with other products that have historically continued to generate strong revenues even as consumers are forced to start tightening their belts. I think of this industry in a similar light as snack foods, where these products offer a “comfort factor” that consumers make a point to include in their household budgets.
TAP is a stock in this industry that offers a good example of the kind of resilience these companies can see in uncertain times. Despite ongoing pressures that really only started with the pandemic but have exacerbated as inflation has become a more prevalent issue, TAP has managed to maintain generally healthy free cash flow. That doesn’t mean they’ve been immune from those pressures – the company suspended their dividend payout early in 2020 to help maintain that balance sheet strength, and were not able to reinstate it until the middle of 2021. 2022 also saw the stock extend a downward trend from a peak at around $61 to a November 2022 low at around $42, and hold in that lower end of its range through most of December. The stock has been somewhat volatile so far in 2023, but unable establish a clear trend to hand its hat on. That means that the real question at this stage is, what does the stock’s latest price action mean against the backdrop of the company’s fundamental strength? Is this a stock that offers a useful value proposition and long-term bargain opportunity, or is this an example of a stock that could expose you to unnecessary risk at the worst time? Let’s find out.
Fundamental and Value Profile
Molson Coors Beverage Company is a holding company. The Company operates through two segments: Americas and EMEA&APAC. The Americas segment consists of the production, marketing and sales of its brands and other owned and licensed brands in the United States, Canada and various countries in the Caribbean, Latin and South America. It operates approximately nine primary breweries, nine craft breweries and two container operations. It also includes a partnership arrangement related to the distribution of beer in Ontario, Canada, and Brewers’ Retail Inc. The EMEA&APAC segment consists of its production, marketing and sales of its primary brands as well as other owned and licensed brands in Bulgaria, Croatia, Czech Republic, Hungary, Montenegro, the Republic of Ireland, Romania, Serbia, the United Kingdom, various other European countries and certain countries within the Middle East, Africa and Asia Pacific. It operates 11 primary breweries, six craft breweries and one cidery. TAP’s current market cap is $11.1 billion.
Earnings and Sales Growth: Over the last twelve months, earnings increased by 60.5%, while sales were -1.53% lower. In the last quarter, earnings declined by about -1.5% while sales also dropped by nearly -10.6%. TAP’s historically narrow margin profile turned negative during the pandemic, but turned positive at the end of 2021. However, the latest earnings reports show that inflationary conditions are having a measurable impact on the company’s profitability. Net Income over the last twelve months was -1.37% of Revenues, and deteriorated significantly in the last quarter to -22.5%.
Free Cash Flow: TAP’s free cash flow is healthy, at $872.8 million for the trailing twelve month period. That translates to a Free Cash Flow yield of 7.9%. This number increased from its $757.4 million mark in the last quarter, but is still below its $1 billion level from a year ago.
Debt to Equity: TAP has a debt/equity ratio of .48, a relatively low number that indicates the company operates with a generally conservative philosophy towards leverage. The company doesn’t have great liquidity, with cash and liquid assets of $600 million against about $6.2 billion in long-term debt. It is worth noting at the end of 2020, cash was about $731 million while long-term debt was around $7.1 billion – meaning that while liquidity has declined, long-term has also been reduced by almost $1 billion. It is also true that since the end of 2018 the company has cleared more than $2.9 billion in long-term debt from their balance sheet – even while factoring in the difficulties of pandemic and other pressures over the last three years.
Dividend: TAP pays a dividend of $1.64 per share, per year, and which translates to an annualized dividend yield of 3.21% at the stock’s current price. After reinstating its dividend in the final quarter of 2020, management increased its payout from $1.36 per share in early 2022, and from $1.52 per share after the most recent earnings report. The reinstatement and consequent increases are a strong indication of management’s confidence.
Price/Book Ratio: there are a lot of ways to measure how much a stock should be worth; but I like to work with a combination of Price/Book and Price/Cash Flow analysis. Together, these measurements provide a long-term, fair value target around $59 per share. That means that TAP is undervalued, with about 14% upside from its current price, and a compelling discount price at around $47.
Technical Profile
Here’s a look at the stock’s latest technical chart.
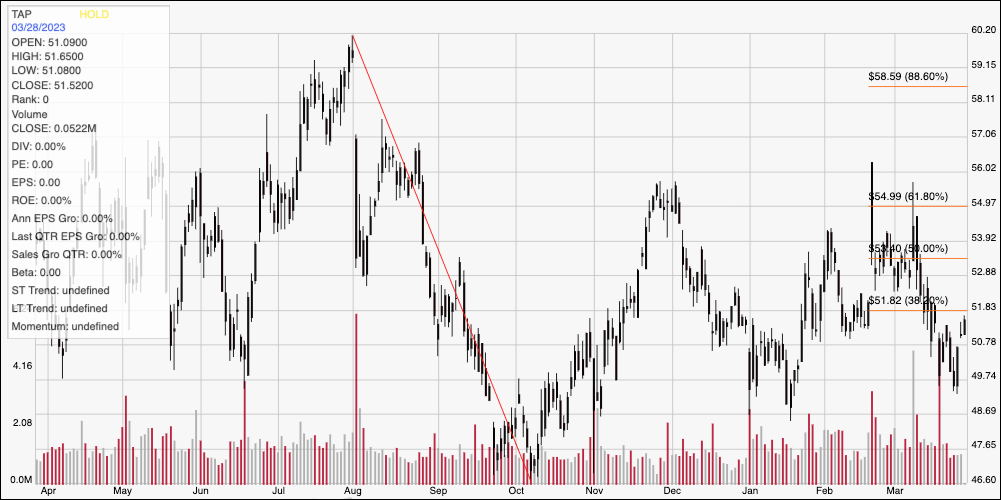
Current Price Action/Trends and Pivots: The chart above displays the stock’s price activity over the last year. The red diagonal line traces the downward trend from its July 2022 peak at around $60 to its October low at around $46.50. It also provides the baseline for the Fibonacci retracement lines shown on the right side of the chart. The stock has staged a couple of short-term, bullish trends to peak at around $55 since then, but each of those rallies has inevitably failed to maintain its momentum. The most recent failed rally came earlier this month, with the stock dropping back below all of its major retracement lines before finding its latest pivot low at around $49 last week. Current support is at around $51, with the stock approaching expected resistance at around $52, roughly inline with the 38.2% retracement line. A push above $52 should give the stock room to rally to about $53.50, where the 50% retracement sits, while a drop below $51 should find next support at the last pivot low, at around $49 per share.
Near-term Keys: With ongoing questions about the long-term health of the economy, including whether the Fed’s current stance towards monetary policy will begin to soften, or keep its hawkish tone, and some larger concerns on a fundamental level in the form of negative Net Income, I’m leery of taking the stock’s value proposition at face value. That means that the best probabilities come in the form of short-term trading strategies. You could use a break above $52 could be a signal to buy the stock or to work with call options, using $53.50 as a nimble, initial target price on a bullish trade. A drop below $51 could offer a signal to think about shorting the stock or working with put options, using $49 as a practical, quick-hit profit target on a bearish trade.