One of the fundamental differences between growth and value investing lies in the way that the extreme ends of price swings are interpreted and used.
Where growth-focused investors view a stock at or near historical highs as a great thing, for example, a value seeker will usually shrug their shoulders and move on to something else. The same mindset can be applied, in opposite fashion, to stocks at or near historical lows. These are situations where bargain hunters start to sit up, take notice, and begin digging in to the company’s details. Growth investors, on the other hand will usually treat the same stock as radioactive and wait for it to reverse its downward trend before thinking seriously about any new investments with that stock.
As a value seeker myself, and somebody with more than just a bit of a contrarian bent, I tend to favor stocks at or near historical lows. That’s because, given that all trends are finite, and will eventually reverse themselves, stocks in the low end of their historical ranges represent some of the highest-probability opportunities we can find. The distinction between the two investing styles is one of the things that I think makes the stock market so interesting, because no matter what anybody says, one method is not categorically better, or is guaranteed to outperform the other in the long run. The suitability of one method over another really boils down to your own individual preference, and the additional steps and strategies you employ to manage the investments you make based on that method.
Since my focus is primarily on value, my natural inclination when I see a stock nearing historical highs is to assume that there isn’t much upside left, and that any additional increase in price is really based primarily on chance rather than on any useful, fundamentally-driven logic. I have also learned, however that nothing in the market is absolute, which is why I also try to leaven any assumption on a stock, at either end of its price range, with a willingness to dive in to the same details I use for underperforming stocks to see if there might still be a useful value opportunity. Sometimes, a company’s underlying fundamental strength is such that even with the stock at or near previous highs, a reasonable fundamental argument can be made that there is value that the market hasn’t yet uncovered. The simple fact that a stock may be sitting at or near historical lows also doesn’t categorically mean the stock offers any kind of historical value if the company’s fundamentals don’t also fall into line.
One of the interesting stories of the last few years is the way that the Consumer Discretionary sector has shown its resilience in the face of difficult conditions, driven by a massive shift to e-commerce services and solutions. Among the shifts that worked in the favor of a lot of different industries in the sector, including stocks in the Textiles, Apparel & Luxury Goods industry during the worst of the pandemic, for example has been an increased focus on personal health and wellness. That is an industry that includes well-known players like Under Armour (UA), Nike (NKE), Hanesbrands Inc (HBI) and today’s highlight, Gildan Activewear (GIL). GIL doesn’t have the same cachet that comes from immediate name recognition, but is a very interesting stock because of its focus on private label apparel.
An increasing number of retailers are shifting the products they offer, increasing shelf and floor space in favor of brands offered only in their own stores. One of GIL’s strategic goals is on partnering with traditional retailers to manufacture those private label goods. It’s a trend that is expected to continue to grow, since private labels offer higher margins in the always-competitive retailing industry where margins are consistently thin and becoming even narrower. Even companies like UA and NKE are tapping in to the resources offered by companies like GIL, where production capacity can be made available closer to home than through the Asian markets these companies have traditionally relied on to produce their own products. That’s dovetailed nicely we their own, increasing focus on building their own direct-to-consumer marketing and distribution channels.
I also think there is an argument to be made that, as interest rates continue to increase to combat high inflation in the U.S., the value of private-label goods is likely to be even more elevated. GIL is a stock that has spent the last year significantly below its $40 high price in April of 2022. Beginning in late December, the stock starting rallying into an intermediate-term upward trend that peaked to start this month at around $34 before dropping back again. The stock is sitting now at a level where it could be poised to extend that upward trend. Are the company’s fundamentals and value proposition attractive enough to suggest the stock should be on your watchlist for a good, potential bargain-based buy? Let’s dive in and find out.
Fundamental and Value Profile
Gildan Activewear Inc. is a Canada-based, vertically integrated manufacturer of everyday basic apparel, including activewear, underwear, and hosiery products. The Company’s primary product categories include activewear tops and bottoms (activewear), socks (hosiery), underwear tops and bottoms (underwear) and intimates. Its activewear product lines include T-shirts, fleece tops and bottoms, and sports shirts. Its hosiery product lines include athletic, dress, casual and workwear socks, liner socks, socks for therapeutic purposes, sheer panty hose, tights, and leggings. Its underwear product lines include men’s and boy’s underwear (tops and bottoms) and ladies panties. The Company’s intimates product lines include ladies shapewear, intimates, and accessories. The products it manufactures, and sells are marketed under Company brands, including Gildan, American Apparel, Comfort Colors, Gildan Hammer, Alstyle and GoldToe. It also sells socks under the Under Armour brand.GIL’s current market cap is $5.8 billion.
Earnings and Sales Growth: Over the last twelve months, earnings declined by about -14.5%, while revenues also decreased, by -8.2%. In the last quarter, earnings were -22.6% lower, while sales declined by about -15.3%. GIL operates with a healthy margin profile that currently reflects the reality of inflationary conditions. Over the last twelve months, Net Income as a percentage of Revenues was 16.71%, but decreased in the last quarter to 11.65%.
Free Cash Flow: GIL’s free cash flow is about $174.4 million, and translates to a modest Free Cash Flow Yield of 3.02%. The current number does mark a decline over the past year from about $368.66 million, and $758.4 million a year and a half ago.
Dividend Yield: GIL’s dividend is $.744 per share, which translates to an annual yield of about 2.32% at the stock’s current price. Management suspended its dividend at the beginning of the pandemic, but reinstated it in 2021 and raised it at the beginning of 2022 to $.676 per share, and to its current level following the latest earnings report.
Debt to Equity: GIL has a debt/equity ratio of .46. This is a conservative number that generally implies a careful approach by management to leverage. GIL’s balance sheet shows a little over $150.4 million in cash and liquid assets (up from $69.26 million in the quarter prior and $121.6 million a year ago) against about $780 million in long-term debt (down from $845 million a year ago). GIL’s margin profile indicates operating profits are more than adequate to service their manageable debt, however narrow liquidity and declining net income are concerns.
Price/Book Ratio: there are a lot of ways to measure how much a stock should be worth; but I like to work with a combination of Price/Book and Price/Cash Flow analysis. All together, these measurements provide a long-term, fair value target around $22 per share. That means that at its current price, GIL is significantly overvalued, with -32% upside from its current price, and a practical discount price at around $17.50. It’s also worth noting that in early 2022, this same analysis yielded a fair value target at around $31.50 per share.
Technical Profile
Here’s a look at the stock’s latest technical chart.
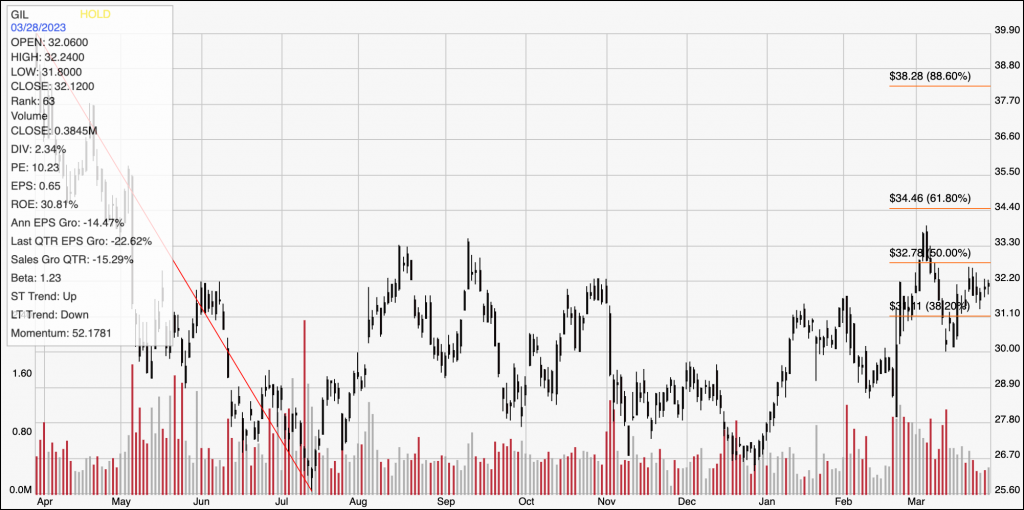
Current Price Action/Trends and Pivots: This chart traces the stock’s movement over the last year. The red line traces the stock’s downward trend from its April 2022 peak at around $40 to its low, reached in June at around $25.50; it also provides the baseline for the Fibonacci retracement lines shown on the right side of the chart. The stock used a low at around $27 in late December 2022 to start its latest rally, pushing to a peak early this month to mark immediate resistance at around $34. The stock dropped back to a low at around $30 in the middle of this month before rallying again, setting current support at around $31.50, right around the 38.2% retracement line. A push above $34 should find next resistance somewhere between $35.50 and $36.50, based on pivot activity seen in April in last year around those levels and depending on the strength of bullish momentum at that time. A drop below $31.50, on the other hand should have somewhat limited downside, with the last pivot low at around $30 providing strong secondary support.
Near-term Keys: If you’re looking for a short-term, bullish trade, a push above $34 could act as a signal to consider buying the stock or to work with call options, with an eye on $35.50 as a useful, quick-hit exit target. If the stock drops below support at $31.50, consider shorting the stock or working with put options, with $30 providing a practical profit target on a bearish trade. GIL is an interesting stock to pay attention to on a long-term basis, however the company’s current decline in Net Income, along with modest Free Cash Flow and narrow liquidity as reflected by cash are concerns that I think bear watching for improvement. These items would need to show significant improvement before the stock’s value proposition is likely to become attractive.