So far in 2023, investors have been anxious to find a thread—any thread—of hope that the economy might turn bullish at some point before 2024.
While interest rates have continued to rise, speculation is increasing that while the Fed will probably not start cutting interest rates this year, they might be ready to start leaving them at current levels – a signal that things have probably gotten as bad as they’re going to get. That provides the thinnest of possible slivers for hope that the proverbial “soft landing” might actually come to pass. If it does, I think that one of the segments of the economy that will clearly benefit is the Financial sector, including trading houses and investment banks.
Interactive Brokers Group Inc (IBKR) isn’t one of the most recognizable names in the Financial sector to the average retail investor. This is a company that has built its reputation for most of the past two decades as a discount broker and market maker by appealing to active investors and day traders, and that expanded its business by giving those accounts access to a widening range of electronic exchanges and market centers – for example, stocks, bonds, options, foreign exchange, and futures, all from a single account. That combination of specialization with comprehensive market access is appealing and has helped establish them as an interesting alternative to larger, more visible names in the Capital Markets industry.
The stock has diverged from the broad market’s direction for the past year, rising from a May 2022 low at around $52 per share to an early March peak a little above $90. Since then, the stock has dropped back a bit, but could be setting up a classic “pullback” short-term pattern that often marks an opportunity to “buy the dip.” Does that pullback also represent an opportunity for a value-oriented investor? The company boasts some interesting fundamental strengths, which could bolster the argument for the stock as a useful long-term opportunity. Let’s dive in to the numbers.
Fundamental and Value Profile
Interactive Brokers Group, Inc. is an automated global electronic broker. The Company custody and service accounts for hedge and mutual funds, exchange-traded funds (ETFs), registered investment advisors, proprietary trading groups, introducing brokers and individual investors. It specializes in routing orders and executing and processing trades in stocks, options, futures, foreign exchange instruments (forex), bonds, mutual funds, ETFs and precious metals on more than 150 electronic exchanges and market centers in 33 countries and 26 currencies around the world. In addition, its customers can use its trading platform to trade certain cryptocurrencies through a third-party cryptocurrency service provider that executes, clears and custodies the cryptocurrencies. Its key product offerings include IBKR Pro, IBKR Lite and IBKR Universal account. Its customers can access its technology through trading platforms, such as Trader Workstation (TWS), BKR Mobile, Client Portal, and others. IBKR’s current market cap is about $8.3 billion.
Earnings and Sales Growth: Over the last twelve months, earnings increased by a little over 64.6%, while revenues were more than 154% higher. In the last quarter, earnings increased by 3.85%, while sales improved by almost 16%. The company operates with a healthy margin profile that increased in the last quarter. Over the last twelve months, Net Income during was 8.82% of Revenues, and increased in the last quarter to 13.99%.
Free Cash Flow: IBKR’s free cash flow is $3.9 billion and translates to a Free Cash Flow Yield of 11.48%. It should also be noted that this number dropped over the last year from $4.2 billion, but improved from $3.5 billion in the prior quarter and $2.35 billion three quarters ago.
Dividends: IBKR pays a dividend of $.40 per share, and which translates to annualized yield of 0.49% at the stock’s current price.
Debt to Equity: IBKR has a debt/equity ratio of 0, which means the company carries no long-term debt. Their balance sheet indicates that in the last quarter, cash and liquid assets were a little over $76.5 billion. This is an interesting element to think about; the company’s total cash is nearly 10x higher than the stock’s total market cap value.
Price/Book Ratio: there are a lot of ways to measure how much a stock should be worth; but I like to work with a combination of Price/Book and Price/Cash Flow analysis. Together, these measurements provide a long-term, fair value target around $65 per share, which means that IBKR is overvalued, with about -19% downside from its current price.
Technical Profile
Here’s a look at the stock’s latest technical chart.
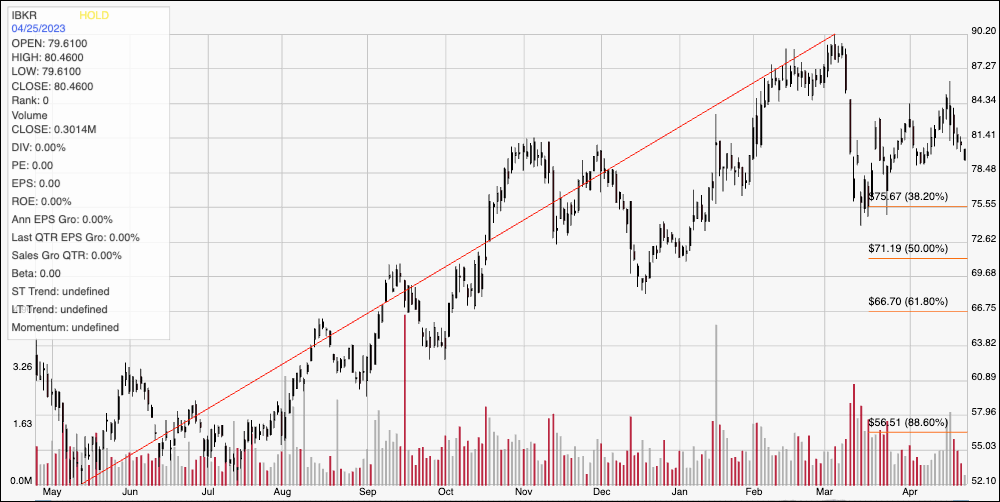
Current Price Action/Trends and Pivots: The chart above traces the stock’s movement over the last year. The diagonal red line traces the stock’s upward trend from its May 2022 low at around $52 to its March peak at around $90. It also provides the baseline for the Fibonacci retracement lines shown on the right side of the chart. After dropping to about $75.50 where the 38.2% retracement line sits, the stock rallied again to mark immediate resistance a little over a week ago at around $84, with current support at around $79, and which is near the stock’s current price. A push above $84 should have near-term upside to about $87 before hitting next resistance, with room to test the 52-week high at around $90 if bullish momentum increases. A drop below $79 will find next support at around $75.50, based on the 38.2% retracement as well the stock’s bounce off of that level in mid-March.
Near-term Keys: IBKR is a company with a number of very interesting fundamental strengths that have helped to drive the stock to its current price levels. Unfortunately, however its long-term trend has outpaced the stock’s value proposition. If you prefer to focus on short-term trading strategies, you could use a drop below $79 acting as a useful signal point to consider shorting the stock or buying put options, with an eye on $75.50 as a practical profit target. A bullish signal could come with a bounce off of $79. That could be a good opportunity to buy the stock, or to work with call options, with an attractive profit target in that case at around $84, and $90 if bullish momentum increases.