One of my favorite movies of all-time is “The Man from Snowy River,” and one of my favorite sound bites from that film comes early in the story, when Kirk Douglas’ crusty codger tells the young hero, “don’t throw effort after foolishness.”
That bit of advice comes back to me fairly often, and I think certainly has solid application in the always challenging process of making sound investment decisions. As a contrarian by nature who prefers to emphasize value, I’ve learned to seek out stocks that have fallen out of favor with the rest of the market. I often like it even more when I see analysts, talking heads and other investors dismissing a company because their stock price has fallen so far, for so long that it may seem like there is no way it could ever recover. I think the opportunity is even better if the company being maligned also has a solid fundamental profile with a leading position in its industry group.
Intel Corp (INTC) is a stock that I’ve followed for quite some time, and that I’ve written about in this space periodically for quite a while. This is one of the 600-lb gorillas of the Technology sector, after all, and the company that has long been considered the gold standard of companies in the Semiconductor industry. The luster on the company’s reputation has been tainted, so say the least over the past three years or so, as challenges in the semiconductor industry that pre-date 2020 have created openings that INTC’s competitors have been able to leverage to seize market share at INTC’s expense. These are among the primary reasons the stock has mostly underperformed the rest of the Tech sector as well as the Semiconductor industry for most of that period, as analysts and investors shared concerns about lost market share in the CPU space, especially in servers, to AMD along with increasing uncertainty about the path ahead for INTC’s 7nm production, and about the company’s heavy, long-term investments into building its own foundry services in the U.S.
Despite a generally solid fundamental profile that has included a healthy balance sheet, strong liquidity, and an increasingly attractive dividend, those issues were enough to prompt a change in executive leadership at the beginning of 2021, with Pat Gelsinger, a long-time Intel employee before leaving in 2009 to lead VMWare, taking the reins. Following Mr. Gelsinger’s arrival, the stock surged to an April 2021 peak at around $68.60 before falling into a downward trend that has kept the stock in bear market territory for most of the past two years. The stock has been hovering around lows not seen since 2015, raising questions among some talking heads and experts about whether INTC’s losses in market share might be irrecoverable.
Perhaps those doubt come, at least in part from Mr. Gelsinger’s deliberate method to unraveling 7 nm production problems, along with the reality that the company’s planned solutions are long-term in nature and require significant capital investment. In March of 2021, the company announced it would invest $20 billion to create Intel Foundry Services, a major expansion of Intel’s manufacturing capacity that started by building two factories in Arizona with an intention to become a major global provider of semiconductor foundry capacity in the U.S. and Europe. The move looks like a great opportunity to benefit from a global desire for non-Asian capacity, but the long-term reality of this project, along with resulting declines in Net Income and Free Cash Flow seem to have given the market enough fuel to keep the stock’s downward trend in place.
Questions remain, of course about how quickly enterprise spending on IT infrastructure will rebound as inflationary concerns continue to rise; this is a side of INTC’s business that held progress back in 2020 as businesses were forced to shift to work from home models that de-emphasized spending on traditional IT purchases. Competitor capture of a big piece of that market at INTC’s expense (from AMD and NVDA, most notably) has also shown an impact as well and is another reason a lot of analysts largely remain bearish about INTC, with most forecasts about results from its developing foundry services not expected to be seen until 2025. Does that mean that considering a new investment in this stock is a perfect example of “throwing effort after foolishness,” or is there a reasonable argument to make for INTC as a solid, long-term value opportunity?
Fundamental and Value Profile
Intel Corporation is engaged in designing and manufacturing products and technologies, such as the cloud. The Company’s segments are Client Computing Group (CCG), Data Center Group (DCG), Internet of Things Group (IOTG), Non-Volatile Memory Solutions Group (NSG), Intel Security Group (ISecG), Programmable Solutions Group (PSG), All Other and New Technology Group (NTG). It delivers computer, networking and communications platforms to a set of customers, including original equipment manufacturers (OEMs), original design manufacturers (ODMs), cloud and communications service providers, as well as industrial, communications and automotive equipment manufacturers. It offers platforms to integrate various components and technologies, including a microprocessor and chipset, a stand-alone System-on-Chip (SoC), or a multichip package. The CCG operating segment includes platforms that integrates in notebook, two in one systems, desktop computers for consumers and businesses, tablets, and phones. INTC’s current market cap is about $126.5 billion.
Earnings and Sales Growth: Over the last twelve months, earnings declined more than -124% while sales also fell by a little more than -36%. In the last quarter, earnings were -310% lower, while sales declined by more than -16.5%. INTC operates with a historically robust margin profile that dropped into negative territory in 2022, and continues to weaken; Net Income versus Revenues over the past year was -5.06%, and -23.54% in the last quarter. Management has attributed the largest portion of the decline to negative Net Income and its impact on Free Cash Flow (see below) to capital expenditures directed to building its foundry business. With reportable results from foundry services not anticipated until 2025, the question of how long this pattern of negative Net Income will continue is a good one that doesn’t have an easy answer at this time.
Free Cash Flow: INTC’s free cash flow has followed Net Income’s negative pattern; in the last quarter, it came in at -$9.6 billion, versus -$13.45 billion in the quarter prior, and -$1.7 billion a year ago. This is a reflection of the same pressures already outlined as related to Net Income, and is a continuing concern that bears watching in the quarters ahead.
Debt to Equity: INTC has a debt/equity ratio of .49. This is a conservative number. The company’s balance sheet indicates that debt service isn’t a problem, with $28.3 billion in cash and liquid assets (compared to $22.5 billion in the previous quarter) against $37.6 billion in long-term debt. A continuation of the negative Net Income and Free Cash Flow patterns will further erode their still-healthy cash balance, so this is another item that is worth continued attention.
Dividend: INTC pays an annual dividend of $.50 per share, which translates to a yield of 1.68% at the stock’s current price. It should also be noted that management decreased the dividend from $1.46 per share after the latest earnings announcement. I take this development as a clear concession to the rising cost pressures that are anticipated to remain in place through the rest of 2023 and possibly through all of 2024.
Price/Book Ratio: there are a lot of ways to measure how much a stock should be worth; but I like to work with a combination of Price/Book and Price/Cash Flow analysis. Together, these measurements provide a long-term, fair value target at around $27.25 per share. That means that at its current price, INTC is overvalued by about -8.5% right now, with a useful bargain price at around $22.
Technical Profile
Here’s a look at the stock’s latest technical chart.
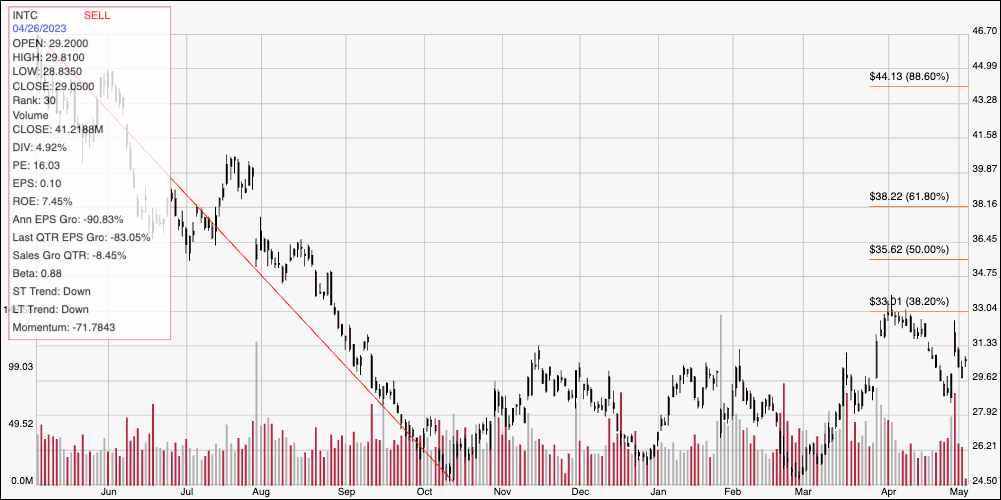
Current Price Action/Trends and Pivots: The chart above displays the last year of price activity for INTC. The red diagonal line traces the stock’s downward trend from a peak a year ago at around $46.50 to its 52-week low, seen at multiple points over the last nine months at around $24.50. It also provides the baseline for the Fibonacci retracement lines on the right side of the chart. The stock rallied off of that yearly low in March to hit its latest pivot high at around $33 to start April before dropping back again to its latest low, marking current support at around $28. Immediate resistance is at that April peak at around $33. A push above $33 could see the stock rally to around $35.50. A drop below $28 should see the stock drop to about $26, with additional room to test the stock’s 52-week low at around $24.50 if selling pressure accelerates.
Near-term Keys: INTC’s overall fundamental strength is experiencing significant challenges right now, and while those are a concern, I also believe that they are a reflection of management’s effort to upgrade existing facilities as well as its intentional move into foundry production and the significant, long-term investment that is required to build and implement that capacity in the U.S. All together, that means that the smart thing is to wait for the time being to see Net Income and Fee Cash Flow start to improve before looking at INTC as a useful long-term opportunity. If you prefer to focus on short-term trading strategies, a push above $33 could provide a good bullish signal to buy the stock or work with call options, using $35.50 as a practical, near-term profit target. If the stock drops below $28, you could also consider shorting the stock or buying put options, with $26 to $24.50 offering a useful, practical short-term target on a bearish trade.