One of the big challenges for average investors like you and me is sifting through the mountains of information that comes from the market on a daily basis.
I think that may be the biggest reason that so many investors have been conditioned over the course of decades of market activity to rely on analyst estimates or broker recommendations. As both an analyst and an investor, I actually find the idea a little ironic, because predicting the future in any context is nothing more than pure guesswork, and any success comes by nothing but sheer luck – but we still keep trying to do it anyway. It’s one of the reasons that, a long time ago, I started studying the principles of value-based analysis.
My study led me to the writings of Benjamin Graham, who is widely credited as the father of fundamental analysis and well-known as the man who taught a young Warren Buffett the basic principles that still drive his investment philosophy today. One of the primary takeaways for me was the way that Mr. Graham didn’t use future estimates in his analysis. He preferred to boil his investment decision to a single, simple question: is the company’s book of business worth more than its stock price today? If the answer was yes, the stock was worth consideration as a long-term investment. The larger the difference between a company’s value and its actual stock price, the more compelling the argument became. Estimates about the future don’t figure into that question, or its answer, at all.
The question of how to determine the value of a company’s book of business has a lot of different possible answers. While Mr. Graham’s original data points for finding that number have become a bit dated, the basic principles he described nearly a hundred years ago still hold true, have become the foundation of the value-based system I use to identify my own investing opportunities, and are the core of the analysis I write about every day in this space.
Now to the stock I’m using to for today’s post. Xerox Holdings Corporation (XRX) is a company that I have followed for some time, and that I have used to pretty nice effect on a number of occasions over the last few years – even during 2020 and 2021, when the entire Business Services industry this company operates in struggled as practically all of corporate America shifted to remote workforce operations and the services that support them because of COVID-19. That working model is still in place for big portions of the business world, however there is also a push for many companies to resume some form of in-office operations. For a business that largely relies on traditional, in-office operations, that means that XRX has focused extensively on cost controls to survive the worst effects of current economic conditions in order to survive. An uptick in office activity is one of the reasons the company reported two-thirds of its business is contracted for multiple years into the future, with a significant backlog that started to unwind by more than double in 2022 versus 2021. These are elements that are anticipated to remain as elements of strength.
XRX’s earnings reports for most of the past three years have indicated big impacts on their business that continue to be felt today. The extended effect remote work continues to have on the Business Services segment, along with the broad market’s bearish conditions, pushed XRX into a strong downward trend that finally found a bottom in October of last year at around $12. The stock has been searching for a trend since that point, rallying to about $18 in late January before dropping back again since then, with the stock picking up a new wave of bearish momentum that has the stock now a little below $13. What does that mean about the stock’s value proposition? Let’s find out.
Fundamental and Value Profile
Xerox Holdings Corporation is a workplace technology company, building and integrating software and hardware for enterprises. It has developed the copier, the Ethernet, the laser printer and more. The Company has capabilities in artificial intelligence (AI), augmented reality (AR) driven service experiences, robotic process automation (RPA), sensors and services for Internet of Things (IoT), three-dimensional (3D) printing and Clean Technologies (clean tech). The Company’s segments include Workplace Solutions which is made up of two strategic product groups, Entry and Mid-Range, which share common technology, manufacturing and product platforms; Production Solutions are designed for customers in graphic communications, in-plant and production print environments with high-volume printing requirements; Xerox Services includes a continuum of solutions and services that helps its customers; and FITTLE is engaged in financing for direct channel customer purchases of Xerox equipment. XRX’s current market cap is about $2.2 billion.
Earnings and Sales Growth: Over the last twelve months, earnings increased by nearly 508.33% (not a typo), while sales were about 2.82% higher. In the last quarter, earnings declined by nearly -45% while revenues were about -11.65% lower. Over the last twelve months, Net Income was -2.73% of Revenues, and strengthened in the last quarter to 4.14%. The positive difference is confirmation of a recovery pattern that began in the second half of 2022.
Free Cash Flow: XRX’s free cash flow was $122 million over the last twelve months, marking a decline from $215 a year ago. The decline isn’t surprising against the backdrop of the last three years. The current Free Cash Flow number also translates to a Free Cash Flow Yield of 5.27%.
Debt to Equity: XRX has a debt/equity ratio of .79. That’s a generally conservative number that reflects management’s careful approach to debt management. Since the beginning of 2018, the company’s long-term debt has decreased from a little more than $5.2 billion to its current level of $2.7 billion (about even with its long-term debt level from a year ago). Their balance sheet also shows more than $1.04 billion in cash and liquid assets, which means that servicing their debt isn’t a problem, and adds an important, additional buffer to go along with improving Net Income.
Dividend: XRX pays a dividend of $1.00 per share, which translates to an annual yield of 6.78% at the stock’s current price.
Price/Book Ratio: there are a lot of ways to measure how much a stock should be worth; but I like to worth with a combination of Price/Book and Price/Cash Flow analysis. Together, these measurements provide a long-term target a little above $10 per share, suggesting that the stock is very overvalued, with -28% downside from its current price.
Technical Profile
Here’s a look at the stock’s latest technical chart.
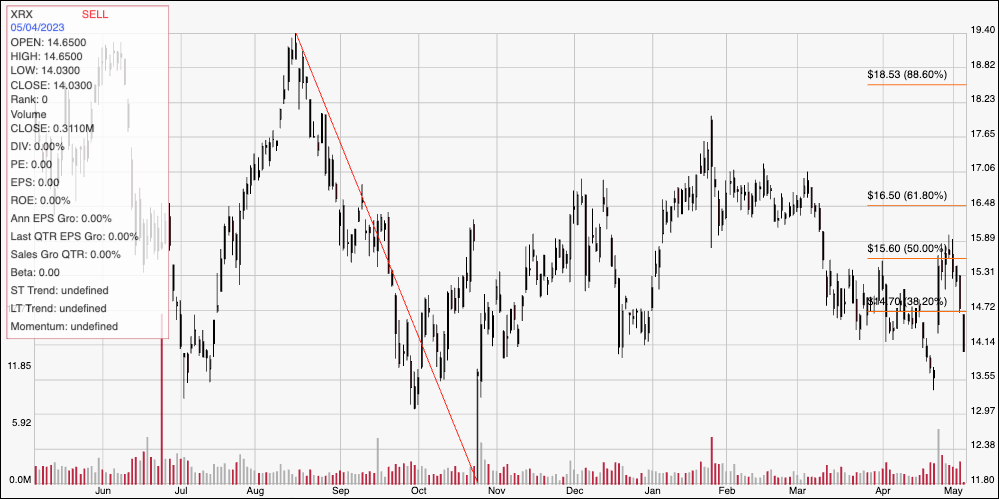
Current Price Action/Trends and Pivots: The diagonal red line traces the stock’s downward trend from its 52-week high at around $19.50 in mid-August of last year to its low at around $12 in October 2022. It also provides the baseline for the Fibonacci retracement lines shown on the right side of the chart. The stock consolidated through most of March, then dropped to mid-April low at around $13.50 before pushing quickly to about $16 after the latest earnings announcement. After that peak about a week ago, the stock has picked up a new set of bearish momentum, dropping below $14 as of the market’s open today and approach that pivot low at around $13.50, where current support should be found. Immediate resistance is around $15, right around the 38.2% retracement line. A push above $15 will find next resistance at around $16, with room to push to about $16.50 where the 61.8% retracement line sits if buying activity increases. A drop below $1.50 should see the stock test next support at around $13, but could drop down to about $12 where the stock’s 52-week low occurred.
Near-term Keys: Unfortunately, XRX doesn’t offer a useful value proposition right now, which means that the best probabilities to work with the stock lie in short-term trading strategies. You could use a push above $15 as a signal to think about buying the stock or working with call options, with $16 providing a practical, quick-hit profit target for a bullish trade. A drop below $13.50 could be a signal to consider shorting the stock or buying put options, with $12 providing a practical exit target on a bearish trade.