No matter what their investment philosophy is, any successful investor will agree that one of the most useful ways to find new opportunities is by maintaining a good watchlist.
A good, diversified list of stocks in a variety of different industries can be an effective way to keep your investing functional, no matter what the ebb and flow of market sentiment is doing at any given time, since as one industry may be moving out of favor with investors, another will undoubtedly be moving into favor.
2022 kept a lot of people on edge as the health of the global economy prompted a broad drop to bear market conditions. Inflationary indicators have led to rising interest rates, which have also been compounded by the effect of Russia’s war with Ukraine. Add to that questions about whether the Fed will manage the proverbial “soft landing” everybody hopes for to avoid a push into actual recession, and it really isn’t surprising that the market’s natural tendency to forecast its fears continues to keep uncertainty high.
The market’s drop over the past year pulled most of the sectors and their respective industries of the economy into their own respective bear market levels. That includes stocks like Eastman Chemical Co. (EMN), one of the biggest companies in the Chemicals industry. The stock hit a high point in January at around $129.50 before following the market into its own bear market, hitting its most recent low in October of last year at around $70 per share. That’s a -46% drop that has the stock sitting at price levels throughout the past year that it hasn’t seen since 2020.
While most companies is just about every sector dealt with a COVID-driven, material impact, as a company, EMN has showed strength throughout the worst of the pandemic; however more recent reports show that the inflationary pressures I described earlier are having an impact on their bottom line, which is certainly a primary motivator for the stock’s extension of the downward to October. Since then, the stock has rallied to its current price at around $86. Are the company’s fundamentals improving as well? Also, what does that mean for the stock’s value proposition? Let’s find out.
Fundamental and Value Profile
Eastman Chemical Company (Eastman) is an advanced materials and specialty additives company. The Company’s segments include Additives & Functional Products (AFP), Advanced Materials (AM), Chemical Intermediates (CI), and Fibers. In the AFP segment, it manufactures chemicals for products in the coatings, tires, consumables, building and construction, industrial applications, including solar energy markets, animal nutrition, care chemicals, crop protection, and energy markets. In the AM segment, it produces and markets its polymers, films, and plastics with differentiated performance properties for end uses in transportation, consumables, building and construction, durable goods, and health and wellness products. The CI segment leverages large scale and vertical integration from the cellulose and acetyl, olefins, and alkylamines streams to support its specialty operating segments. Its product lines in Fibers segment include Acetate Tow, Acetate Yarn and Acetyl Chemical Products. EMN’s current market cap is $9.7 billion.
Earnings and Sales Growth: Over the last twelve months, earnings declined by about-21% while revenues also declined by at -11.13%. In the last quarter, earnings increased by more than 83% while sales were 1.64% higher. The company’s margin profile is showing signs of weakness that contradict the improving picture just described; Net Income for the last twelve months was 6.73% of Revenues, and declined to 5.56% in the most recent quarter.
Free Cash Flow: EMN’s free cash flow is modest, at $271 million. This is a number that declined over the past year, from about $617 million, and $351 billion in the quarter prior. It also translates to a Free Cash Flow yield of 2.81%.
Debt to Equity: EMN has a debt/equity ratio of .88, implying a generally conservative approach to debt management. The company’s balance sheet indicates their operating profits are more than adequate to service their debt for the time being, however declining Net Income and Free Cash Flow together don’t leave a lot of room for error. Their balance sheet shows $599 million in cash and liquid assets versus about $4.6 billion in long-term debt.
Dividend: EMN pays an annual dividend of $3.16 per share, which translates to a yield of about 3.9% at the stock’s current price. It should also be noted that management increased their dividend payout from $2.64 per share at the end of 2021 to $3.04 in 2022, and to its current level at the start of this year. An increasing dividend payout is an additional sign of management’s confidence in their business model moving forward.
Price/Book Ratio: there are a lot of ways to measure how much a stock should be worth; but I like to work with a combination of Price/Book and Price/Cash Flow analysis. Together, these measurements provide a long-term, fair value target at around $72.50 per share. That means that the stock is undervalued at its current price, with -10.3% downside from the stock’s current price, and a practical discount price at around $58 per share. It’s also worth noting that at the start of this year, this same analysis yielded a fair value target at around $88.50 per share.
Technical Profile
Here’s a look at the stock’s latest technical chart.
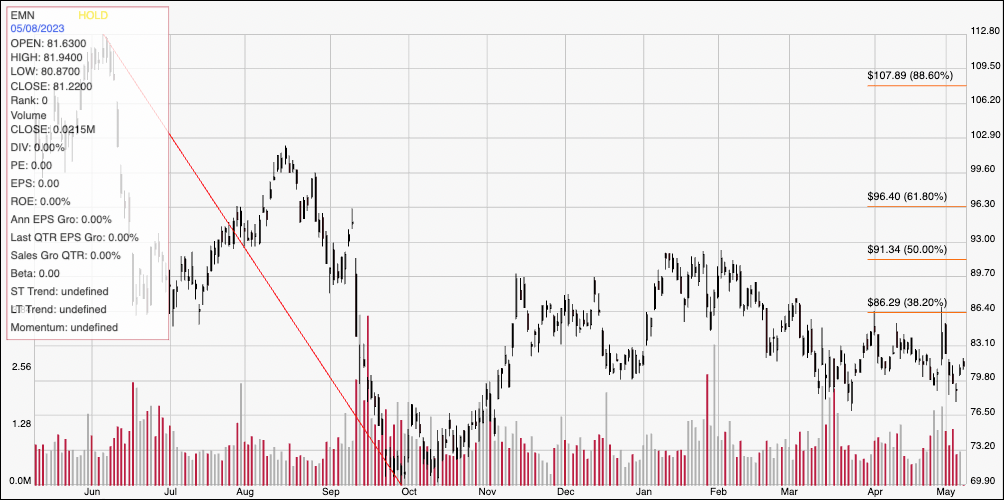
Current Price Action/Trends and Pivots: The diagonal red line traces the stock’s downward trend from $113 in May of 2022 to its low point, reached in October at around $70; it also provides the reference for calculating the Fibonacci retracement levels on the right side of the chart. The stock rallied from that low, hitting a peak at around $91 in January before sliding back to a march low at around $78. The stock has been hovering since between current support at $78 and immediate resistance at around $86, where the stock has seen three pivot highs in the last five weeks. A push above $86 will give the stock room to rally to about $91, while a drop below $78 should find next support at around $73.
Near-term Keys: There really is no way right now to call the stock a useful value at its current price; the stock would need to fall to about $58 before a practical, useful discount would really be available. If you prefer to work with short-term strategies, I would pay close attention to the stock’s current support and resistance levels. A push above $86 could offer a good signal to consider buying the stock or working with call options, with $91 acting as a practical profit target on a bullish trade. A drop below $78 would be a good signal to think about shorting the stock or buying put options, with $73 acting as a good profit target on a bearish trade.