Over the course of my investing career, I’ve learned to rely on a lot of fundamental data to describe the underlying strength of any stock I might consider using for a value-based investment.
I’ve also learned to go beyond easy-to-reference, quick-glance data like earnings per share and price-to-earnings ratios, and to expand my view of a company’s profitability by also looking at the company’s pattern of Net Income and Free Cash Flow growth. Earnings per share is a useful, standardized method of describing a company’s profit in a given period on a per-share basis; but it is also a number that can be calculated a number of different ways, which means that there is quite a bit of subjectivity a creative financial manager can inject into a company’s earnings numbers.
On the other hand, Net Income (income remaining after expenses) and Free Cash Flow (the cash left after operating expenses and capital expenditures) are generally more straightforward, less malleable measurements, which is why I find them generally more reliable. That doesn’t mean earnings don’t have a place in my process. In fact, I like to use all three measurements together. A pattern of growth in EPS, Free Cash Flow and Net Income together is ideal, while divergences in one or more of these data points relative to the others can signal problems that need to be examined in more detail.
One of the stocks that has become like an old, familiar friend for me over the last few years is Bristol-Myers Squibb Company (BMY). This is a stock that I had already followed for about two years and used a few times to nice overall effect in 2020, but that hasn’t drawn a ton of attention since as most of the focus has shifted to inflation, interest rate increases, war, and whether the combined mix of a lot of global uncertainty will push the U.S. economy into a new, extended recession.
The simple fact is that while many want to push the pandemic into the background, COVID remains a fact of life. I think part of the desire to move on from COVID fears is a reflection of the reality that persistent demand for other, “normal” types of health care must also be accounted for. I think that is where BMY has an important role to play not only in society but in a smart investor’s watchlist right now. This is a stock that saw some volatility in 2022, moving between its yearly low at around $66 to ranges around its yearly high at $81.50. The stock has fallen dramatically from that early December peak, dropping to a march low at around $65 and now sitting just a few dollars above that point.
The bottom of a downward trend can mark the beginning of consolidation periods, which are interesting, because they often provide a springboard for the stock’s next trend. While the direction of the next trend is the proverbial, million-dollar question, these periods also offer a good opportunity to take stock of the company’s underlying strengths and weaknesses. For BMY, fundamental strengths include healthy Free Cash Flow and healthy liquidity, counterbalanced by drawdowns over the past year in both metrics that can broadly be attributed to rising input costs that have affected every sector of the economy and have forced multiple interest rate increases throughout the past year and a half and only recently may have begun to moderate.
On any industry level, BMY boasts one of the strongest, long-term development pipelines in the Pharmaceutical industry that became even less concentrated and more diversified with the completion of its 2018 Celgene acquisition. I think the new, combined company dovetails nicely with what I believe will inevitably be an increased level of scrutiny and attention – appropriately so, and in the long run, to our collective benefit – on proper health and care on an individual level. Is that enough to make the stock a useful value at its current price? Let’s dive in to the numbers.
Fundamental and Value Profile
Bristol-Myers Squibb Company is engaged in the discovery, development, licensing, manufacturing, marketing, distribution and sale of biopharmaceutical products. The Company’s pharmaceutical products include chemically synthesized drugs, or small molecules, and products produced from biological processes called biologics. Small molecule drugs are administered orally in the form of a pill or tablet. Biologics are administered to patients through injections or by infusion. The Company’s products include Empliciti, Opdivo, Sprycel, Yervoy, Eliquis, Orencia, Baraclude, Hepatitis C Franchise, Reyataz Franchise and Sustiva Franchise. It offers products for a range of therapeutic classes, which include virology, including human immunodeficiency virus (HIV) infection; oncology; immunoscience, and cardiovascular. Its products are sold to wholesalers, retail pharmacies, hospitals, government entities and the medical profession across the world. BMY has a current market cap of $143.5 billion.
Earnings and Sales Growth: Over the last twelve months, earnings increased by about 4.6%, while sales decreased -2.67%. In the last quarter, earnings were 12.64% higher while sales growth was slightly negative, at -0.6%. BMY’s operating margins are a sign of strength, as Net Income versus Revenue over the last twelve months was 15.95%, and increased to 19.95% in the last quarter.
Free Cash Flow: BMY’s Free Cash Flow is healthy, at a little over $11 billion. That marks a decline from about $14.2 billion a year ago and $11.9 billion in the prior quarter. It also translates to a Free Cash Flow Yield of 7.7%. The strength comes from the size of this number, implying that the company’s ability to service its debt, maintain its dividend and keep its business growing remains intact. The declining pattern is a concern as it reflects the reality of rising input costs.
Debt to Equity: BMY has a debt/equity ratio of 1.1 – a high number that is primarily attributed to the debt assumed during the completion of the Celgene deal. As of the last quarter, cash and liquid assets were about $9.27 billion versus $35 billion in long-term debt. Pre-merger, BMY had just $5.3 billion in debt versus more than $8 billion in cash; however management as well as most analysts predicted the deal would be immediately accretive. So far that appears to be the case, which means the high debt level continues to be more than serviceable. I think it is also worth noting that long-term debt has declined by about $4.9 billion since the beginning of 2022. On the flip side, liquidity has declined steadily over the past year, from about $14.9 billion in early 2022, which confirms the declining Free Cash Flow pattern I mentioned earlier.
Dividend: BMY pays an annual dividend of $2.28 per share (increased at the beginning of 2022 from $1.96 per share, and $2.16 per share in the final quarter of that year), which at its current price translates to a dividend yield of about 3.33%. Management also increased the dividend from $1.80 per share, per annum in mid-2020. An increasing dividend is a strong signal of management’s confidence in its business strategy and overall financial strength.
Price/Book Ratio: there are a lot of ways to measure how much a stock should be worth; but I like to work with a combination of Price/Book and Price/Cash Flow analysis. Together, these measurements provide a long-term, fair value target around $62 per share. That suggests that BMY is overvalued at its current price, with -9.25% downside from its current price and a practical discount price at around $50. This metric has also decreased from its $83.50 fair value target in February of 2022.
Technical Profile
Here’s a look at the stock’s latest technical chart.
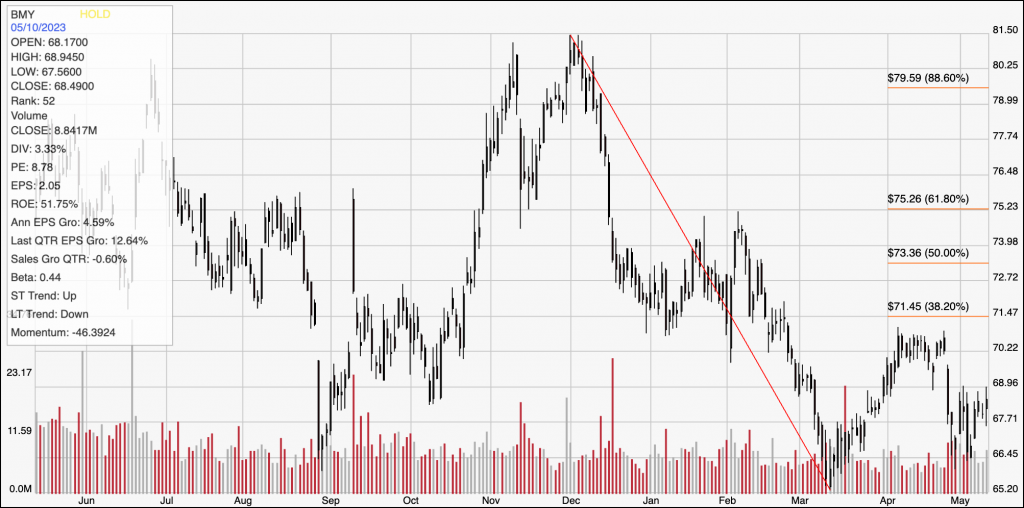
Current Price Action/Trends and Pivots: The chart above displays the last year of price activity for BMY. The red diagonal line traces the stock’s downward trend from its December 2022 peak low at about $81.50 to its low in March at around $65; it also provides the baseline for the Fibonacci retracement lines shown on the right side of the chart. The stock rallied to an April plateau at around $71, just a little below the 38.2% retracement line to mark immediate resistance at $71.50. Current support is at the pivot low established this month when the stock dropped off of that peak at around $66.50. A push above $71.50 should see near-term upside to about $74 per share, and $75 if buying activity increases. A drop below $66.50 has limited downside, with the stock’s 52-week low at around $65 waiting to provide next support.
Near-term Keys: BMY’s fundamental profile is healthy in many respects, with a useful decrease in long-term debt helping to keep the company’s financial flexibility strong. That said, the current decline in Free Cash Flow and liquidity has extended for over a year, and is reason enough to accept the fact that the stock doesn’t offer a useful value at its current price. I would look for the stock to either break down into the low-$50 range, or show more material improvements in its fundamental metrics that improve the argument for a higher value-driven price first. If you prefer to work with short-term trading strategies, the best opportunity to work with the stock would come from a push above $71.50. That would provide a good signal to buy the stock or work with call options, with a useful, bullish target price between $74 and $75 per share. The stock’s proximity to its 52-week low suggests that a bearish trade, by shorting the stock or buying put options is likely a vert low-probability, low-reward prospect and should be avoided for the time being.