One of the first technical principles I learned more than two decades ago has become a primary reference point for helping me think about a stock’s current direction: “the trend is your friend.”
For bullish traders, this phrase means that if you can find a stock that is already going up, it is likely to keep going up – especially if the stock has broken above previous highs. It can also be applied to stocks in downward trends for the same kinds of traders, because downward trends generally act as warning flags for momentum-based, trend-driven investors to stay away for the time being or to consider bearish trading strategies.
All of the logic I just outlined gets turned on its head a bit when you start talking about principles that drive other, longer-term investing methods and approaches. The longer my investing career has lasted, the more I’ve gravitated to value-driven strategies. Being a value investor doesn’t automatically dismiss the idea of using trends, but it is a bit counter-intuitive to some at first, because it doesn’t shy away from stocks in downward trends – in fact, I’ve learned to sit up and take extra notice in these cases.
I’ve learned that the downward trends most people shy away from often provide the basis for many of the best value-based investments I’ve made. That’s because even as the market tends to overprice good news and its positive expectations into stocks, it also often over-punishes bad news or less-than-rosy expectations. In the negative case, that means downward trends often push stock prices further below the “fair” values a deeper analysis of the company reveals. If the company’s core fundamental strength is still in place, the downward trend can often simply be attributed to current market action. That implies the market will eventually recognize the stock’s deeply discounted status as well.
Value-driven analysis provides investors like me an opportunity to identify where those opportunities may lie before the rest of the market starts to jump onboard. Even better in my view are the cases where the stock has been following a downward trend, but begins to show strong technical signs of a reversal of that trend to bullish conditions. The early stages of that reversal can be thought of as the “sweet spot” for people like me that try to combine value-driven discipline with technical techniques, but are still ahead of the point where most growth-focused investors to start to jump on the bandwagon.
The caveat for any long-term investing method, however, lies in the fundamental data. If the company’s fundamentals are showing deterioration, over time or across multiple metrics, there is a stronger case to make for another common idiom technicians love to quote: “the market is always right.” That’s why using value investing concepts to drive investment decisions can sometimes be challenging.
Westrock Company (WRK) is a stock in the Basic Materials sector that followed a downward trend for most of 2022, but saw a low point in early October at about $30 per share. The stock held a consolidation range from November through January of this year between $37.50 and about $35. That range was broken on the downside in February, with a big, overnight drop of more than -10% following its start-of-the-year earnings report, with the latest bottom coming in mid-March at around $27 per share, with the stock now only a little above that point and showing continued downward momentum. Is the news really as bad is it might seem? With its latest earnings announcement coming at the start of May, how has a new set of financial data impacted WRK’s value proposition? Could it offer a useful bargain-driven opportunity? Let’s dig in.
Fundamental and Value Profile
WestRock Company, incorporated on March 6, 2015, is a multinational provider of paper and packaging solutions for consumer and corrugated packaging markets. The Company also develops real estate in the Charleston, South Carolina region. The Company’s segments include Corrugated Packaging, Consumer Packaging, and Land and Development. The Corrugated Packaging segment consists of its containerboard mill and corrugated packaging operations, as well as its recycling operations. The Consumer Packaging segment consists of consumer mills, folding carton, beverage, merchandising displays, and partition operations. The Land and Development segment is engaged in the development and sale of real estate primarily in Charleston, South Carolina. WRK has a current market cap of $7.1 billion.
Earnings and Sales Growth: Over the past year, earnings decreased about -34.2%, while sales declined by -1.94%. In the last quarter, earnings were 40% higher, while sales increased by 7.2%. Over the last twelve months, Net Income was -5.86% of Revenues, and dropped dramatically to -38% in the last quarter. That rapid deterioration is a major red flag that means the company is spending more than it is bringing in right now.
Free Cash Flow: WRK’s Free Cash Flow is healthy, at about $879.4 million, and which translates to a healthy Free Cash Flow Yield of 12.44%. It does mark a decline over the last quarter, when Free Cash Flow was $1.1 billion, and $1.3 billion a year ago. With the company’s
Debt to Equity: WRK has a debt/equity ratio of .93, which has been rising since the third quarter of 2022, from .66, and coincides with an increase in debt of about $1.5 billion over the same period of time. The company’s balance sheet shows limited liquidity, with cash and liquid assets of about $363.4 million in the last quarter versus long-term debt of about $9 billion. The company focused for most of 2020 and 2021 on debt reduction, most of which came from the 2018 acquisition of KapStone Packaging. As of the second quarter of 2022, they had retired enough of that debt to reinstate stock buybacks.
Dividend: WRK pays an annual dividend of $1.10 per share, which at its current price translates to a dividend yield of about 3.98%.
Price/Book Ratio: there are a lot of ways to measure how much a stock should be worth; but I like to work with a combination of Price/Book and Price/Cash Flow analysis. Together, these measurements provide a long-term, fair value target at around $35 per share. That suggests that WRK is undervalued by about 28% from its current price. It should also be noted that in the last quarter, this same analysis yielded a fair value target at around $45 per share.
Technical Profile
Here’s a look at the stock’s latest technical chart.
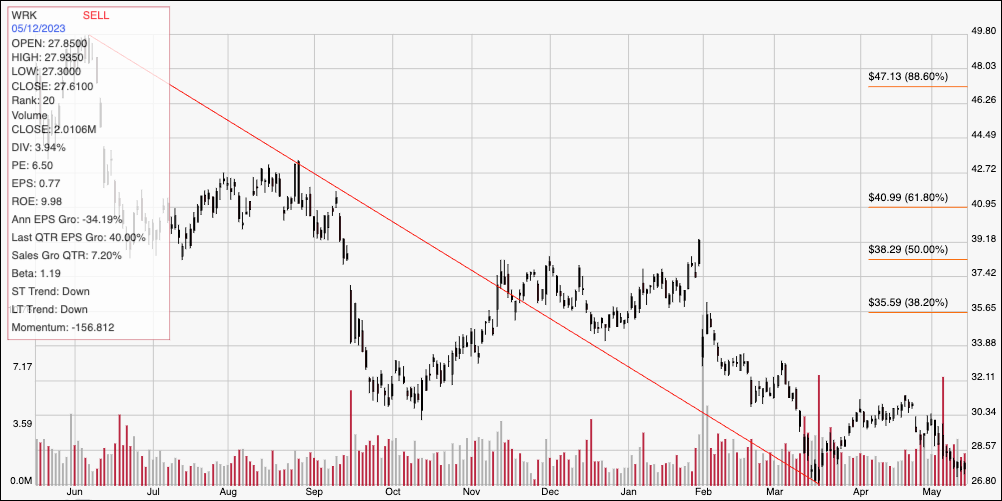
Current Price Action/Trends and Pivots: The chart above displays the last year of price activity for WRK. The diagonal red line marks the stock’s drop from its yearly high, reached in May of last year at around $50, to its 52-week low, reached in March at around $27 per share. It also provides the baseline for the Fibonacci retracement lines shown on the right side of the chart. After rallying to an April peak at around $31, the stock dropped back again and is nearing current support at its yearly low, with immediate resistance at around $29. A push above $29 will find next resistance at around $31, with additional room to about $34 if buying activity increases. A drop below $27 should find next support at around $25, using the distance between current support and resistance as a benchmark.
Near-term Keys: WRK’s extension of its bearish trend is a bearish signal for momentum-driven investors. The value proposition is tempting, but the significant deterioration in Net Income is a major red flag that I think should put anybody thinking about using the stock for a new, value-based opportunity think twice. That means that the best probabilities like in working with short-term strategies. You could use a push above $29 as a signal to think about buying the stock or working with call options, with $31 offering a reasonable, quick profit target for a bullish trade, and $34 possible if buying activity continues. A drop below $27 could be a reason to consider shorting the stock or buying put options, with a useful profit target at around $27 per share on a bearish trade.