There is a pretty significant difference in the way different investors perceive a stock in a long-term trend.
For growth oriented-investors, the longer the upward trend lasts, the more attractive the stock is, simply because the expectation is that the longer, bullish trend will outlast any near-term, bearish sentiment or momentum the stock may see. By contrast, for value-oriented investors, a stock in an upward trend – especially a long-term one – is something that should generally be avoided. That is especially true if, like me, they also tend to operate with a bit of a contrarian view of the world.
For value investors, that contrarian logic makes downward trends look more attractive. The challenge is that, just as often as not, a stock in a long downward trend has a very good reason for being where it is – sometimes, a cheap stock isn’t really a good bargain, it’s just a cheap stock. Efficient market theory holds that in the broadest sense, the market is very good at pricing a company’s underlying fundamental weakness or strength into a stock’s price. That is often very much the case, which is why it is important to always be careful about considering a stock in a long-term downward trend for any kind of bullish position. It’s why I concentrate not only on a stock’s value proposition, but also make sure to run through a detailed view of the company’s business.
The idea that near-term trends tend to follow the direction of their longer trend is a technical idiom that tends to contribute to the “buy the dip” mentality that often comes to play when a stock starts to drop off of a recent high point. The dip comes when growth investors start taking profits; the increase in selling activity puts downward pressure on the price until investors decide the stock is at a good price again, and then start buying the stock again. For a value investor, those dips become more interesting the further away from the last high the stock falls, because it increases the chances the stock’s useful value price will fall into line with its current price.
The Mosaic Company (MOS) is a company in the Materials sector I’ve followed for some time, and that followed the broad market in 2021 and the first quarter of 2022, with an upward trend that saw the stock more than double in value. From its peak at around $79 in April of last year, however, the stock had dropped into a clear downward trend that appeared to find a bottom in January at around $40. The stock then rallied to a peak in early March at around $57 before capitulating to the longer downward trend through the beginning of this month. In the last week or so, the stock has again appeared to form a new support level around its latest 52-week low, in the $34.50 price area. For growth investors, that’s scary, because the stock has fallen close to -50% from that March high. What about for bargain hunters? What do the company’s fundamentals say about how much the stock should be worth compared to its current price? Let’s find out.
Fundamental and Value Profile
The Mosaic Company is a producer and marketer of concentrated phosphate and potash crop nutrients. The Company operates through three segments: Phosphates, Potash and International Distribution. The Company is a supplier of phosphate- and potash-based crop nutrients and animal feed ingredients. The Phosphates segment owns and operates mines and production facilities in Florida, which produce concentrated phosphate crop nutrients and phosphate-based animal feed ingredients, and processing plants in Louisiana, which produce concentrated phosphate crop nutrients. The Potash segment mines and processes potash in Canada and the United States, and sells potash in North America and internationally. The International Distribution segment markets phosphate-, potash- and nitrogen-based crop nutrients and animal feed ingredients, and provides other ancillary services to wholesalers, cooperatives, independent retailers and farmers in South America and the Asia-Pacific regions. MOS has a current market cap of about $11.7 billion.
Earnings and Sales Growth: Over the last twelve months, earnings declined by -52.7%, while revenues also fell by -8.11%. In the last quarter, earnings decreased by about -34.4%, while revenues declined by about -19.6%. The company’s margin profile has been healthy over the past year, but has shown the impact of rising costs on a quarterly basis; over the last twelve months, Net Income was 15.08% of Revenues, and declined to 12.06% in the last quarter.
Free Cash Flow: MOS’s free cash flow over the last twelve months is about $2.3 billion. That’s a decline from about $2.7 billion in the quarter prior, but still a useful increase from $1.7 billion a year ago. The current number also translates to a healthy Free Cash Flow Yield of 19.41%.
Debt to Equity: MOS has a debt/equity ratio of .20. This is a conservative number. MOS currently has $464.8 million in cash and liquid assets against about $2.4 billion in long-term debt. The company’s balance sheet, along with their increasing cash flow and still-healthy margin profile all indicate that the company has no problem servicing the debt they have. It’s also worth noting that over the last year, MOS has retired nearly $1 billion in long-term debt.
Dividend: MOS’s annual divided is $.80 per share; that translates to a yield of 2.24% at the stock’s current price. It is worth noting that the dividend increased from $.30 per share, per annum at the end of 2021 to $.44 per share, and to $.60 early in 2022, and its current level at the beginning of 2023. An increasing dividend is a strong sign of fundamental strength.
Price/Book Ratio: there are a lot of ways to measure how much a stock should be worth; but I like to work with a combination of Price/Book and Price/Cash Flow analysis. Together, these measurements provide a long-term, fair value target around $48 per share. That means that MOS is significantly undervalued, by about 34% from its current price. It’s also worth nothing that earlier this year, this same analysis yielded a fair value target price of $68 per share.
Technical Profile
Here’s a look at the stock’s latest technical chart.
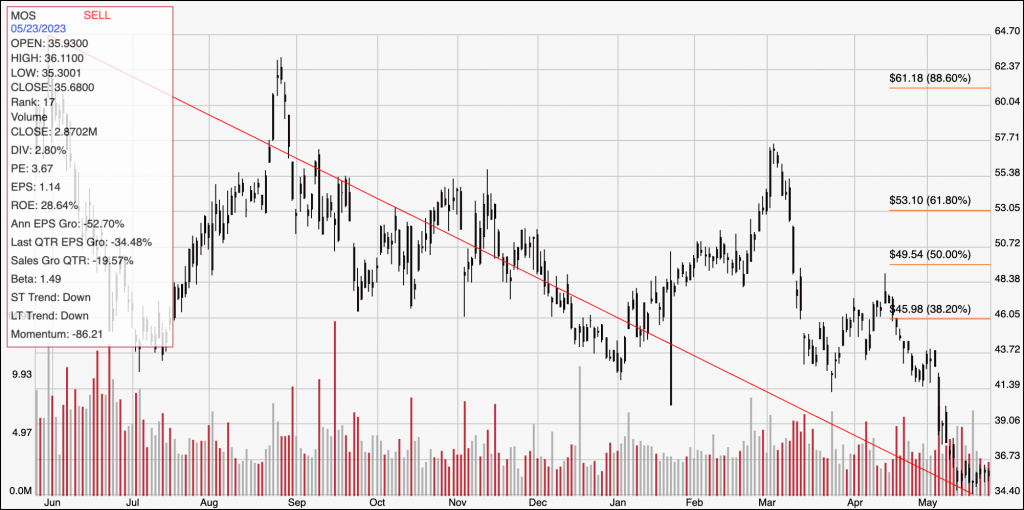
Current Price Action/Trends and Pivots: The red line on the chart above outlines the stock’s downward trend from its peak at around $65 in May of last year to its recent, new 52-week low at around $34.50; it also informs the Fibonacci retracement levels on the right side of the chart. The stock hit its latest low about a week ago, and has been hovering near that same level, marking current support at around $34.50, with immediate resistance at around $36. A push above $36 should have near-term upside to about $40, based on pivot activity in January, while a drop below $34.50 should find next support at around $33, using the current distance between support and resistance as a reference point.
Near-term Keys: MOS’ extension of its long-term downward trend makes near-term, bullish trading strategies very aggressive. That said, if you’re willing to be speculative, a push above $36 could be an interesting signal to think about buying the stock or working with call options, with $40 providing a useful profit target on a bullish trade. A drop below $34.50 would act as a useful bearish signal to consider shorting the stock or buying put options, with $33 providing a practical, near-term profit target. The company’s fundamental strength supports a compelling value proposition, which could be a good reason to think about using MOS for a productive long-term opportunity – however, the stock’s long-term trend does imply there could be more downside ahead. Remember that if you decide to buy the stock at its current price, you need to willing to accept that very real possibility.