One of my favorite methods to quickly filter through the thousands of companies in the stock market is to focus on stocks that pay a consistent dividend.
There are a couple of primary methods companies have to return the value of their business to shareholders. If you pay much attention to market media, you’ve probably heard or read about stock buybacks, where a company purchases its own stock from the broad market. By reducing the amount of available shares in the marketplace, the company can often provide a bullish source of momentum over time via buybacks, which theoretically should increase the value of its shareholders’ respective positions. I say theoretically, because buybacks take a lot of time to be completed, and the company’s buying activities get mixed in with all of the other daily activity that takes place for the stock, including institutional trading as well as trading by average, retail investors like you and me.
I think the second method, dividends, is a better way for a company’s executive management team to return value to its shareholders. A consistent dividend represents an immediate measurable commitment by management, and a useful, passive income source for long-term investors. The cash a shareholder receives from a dividend payout can be used for additional investments (including buying more shares of the company), or simply to cover living expenses and other cash needs. No matter how you intend to use them, you can think of a dividend as cash in your pocket that you get for doing nothing more than holding shares in a company you already like. That’s why I like to call dividends the “low-hanging fruit of the stock market.”
One of the sectors where I have found a number of useful, dividend-paying companies is the Materials sector. This is a sector that also provides what I believe is a good barometer for broader economic activity. That’s because the companies that comprise it produce or mine many of the raw materials that make up the building blocks for most of the finished goods we use every day. The sector includes industries that cover chemicals and plastics, construction materials, paper, forest, and packaging products, and even metals and minerals – which means that in some form, this sector touches practically every other segment of the economy in one form or another.
2022 saw a lot of market volatility that pushed a number of the stocks in this sector into downward trends. Most of the factors that contributed to market volatility in 2022 – inflation and interest rates, and the war in Ukraine to name just the biggest headlines – continue to contribute to market uncertainty right now. After staging a strong initial start to the new year, the elements I just described have been joined with mixed earnings results that have pushed many of the stocks in the Materials sectors into extensions of their longer downward trends that are beginning to test historical lows.
Huntsman Corp (HUN) is a company that has benefitted from a homebuilding industry that saw a surprising level of robustness in 2020 and 2021, as residential construction saw big increases in numerous parts of the country. The last few months have blunted some of that enthusiasm, and the effect is being seen on the company’s bottom line. The good news is that management announced a 12% increase in its annual dividend payout at the beginning of the year, and despite some of those drawdowns, the company’s overall fundamental strength remains largely intact. Contrasted against its fundamental backdrop, including the dividend increase, the stock’s price activity this year has seen a drop from its early February peak at about $33 to its current price below $24, and within spitting distance of the stock’s 52-week low point. That begs the question of whether the stock might offer a useful value proposition along with its attractive dividend yield at its current price. Let’s dive in.
Fundamental and Value Profile
Huntsman Corporation is a manufacturer of differentiated organic chemical products and of inorganic chemical products. The Company operates all of its businesses through its subsidiary, Huntsman International LLC (Huntsman International). The Company operates through five segments: Polyurethanes, Performance Products, Advanced Materials, Textile Effects, and Pigments and Additives. Its Polyurethanes, Performance Products, Advanced Materials and Textile Effects segments produce differentiated organic chemical products and its Pigments and Additives segment produces inorganic chemical products. The Company’s products are used in a range of applications, including those in the adhesives, aerospace, automotive, construction products, personal care and hygiene, durable and non-durable consumer products, digital inks, electronics, medical, packaging, paints and coatings, power generation, refining, synthetic fiber, textile chemicals and dye industries. HUN’s current market cap is $4.3 billion.
Earnings and Sales Growth: Over the last twelve months, earnings declined -83.2%, while revenues also shrank by about -33%. In the last quarter, earnings were 400% higher (not a typo) while revenues declined by about -2.8%. HUN’s operating profile confirms the quarterly improvement in earnings. In the last year, Net Income was 5.11% of Revenues, and strengthened to 9.53% in the last quarter. That includes a reversal of an extended pattern of declining Net Income that dropped into negative territory to start this year, and could be a leading sign of improvement for some of my other favorite fundamental metrics.
Free Cash Flow: HUN’s free cash flow is $426 billion. This marks a drop over the last year, when Free Cash Flow was $986 million, and $642 billion in the last quarter. The current number translates to a Free Cash Flow Yield of 9.52%. One key I will be looking for in the quarters ahead is if the strength in earnings growth and Net Income in the last quarter carries over to Free Cash Flow. A positive turn would be a strong signal management has weathered broader economic difficulties and could be coming out on the other side in good shape.
Debt to Equity: HUN has a debt/equity ratio of .38. This is a conservative number that signals management’s conservative approach to debt management. HUN’s balance sheet shows that total cash in the last quarter was about $615 million (down from $807 million about a year and a half ago), while long-term debt is $1.5 billion. Debt service is not a concern given the company’s still-healthy Free Cash Flow, improving operating profile and a balance sheet that remains healthy even with its drop over the last year.
Dividend: HUN pays an annual dividend of $.95 per share, which translates to an annual yield of about 3.85% at the stock’s current price. It is also worth noting that along with the latest increase from $.85 per share, management increased the dividend at the beginning of 2022 from $.75 per share, and from $.65 per share earlier in 2021. An increasing dividend is a significant signal of management’s confidence in their business in the months and years ahead.
Price/Book Ratio: there are a lot of ways to measure how much a stock should be worth; but I like to work with a combination of Price/Book and Price/Cash Flow analysis. Together, these measurements provide a long-term, fair value target at around $37 per share. That suggests that at its current price, the stock is significantly undervalued, with about 56.5% upside from its current price.
Technical Profile
Here’s a look at the stock’s latest technical chart.
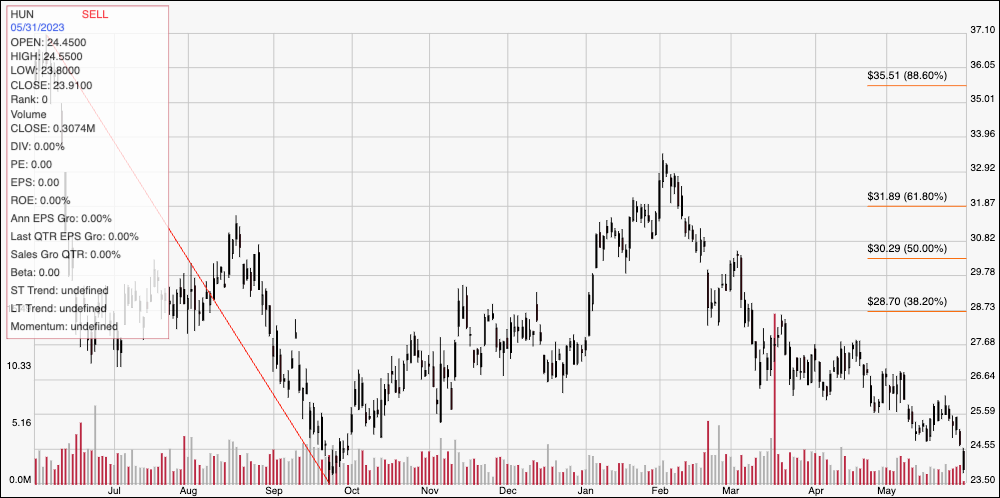
Current Price Action/Trends and Pivots: The diagonal red line on the chart above traces the stock’s downward trend from a peak at around $37 in June of last year to its low point around $23.50, reached in late September. It also provides the baseline for the Fibonacci retracement lines shown on the right side of the chart. After peaking to start February at around $33, the stock has dropped back into an extension of its downward trend, and is now approaching that September low near $23.50, where current support should be found. Immediate resistance is at about $25, where the last pivot low point occurred earlier this month. A push above $25 could have upside to about $26.50, where next resistance could be found based on a lot of pivot activity in that range dating all the way back to October of last year. A drop below $23.50 should find next support at around $22, based on the current distance between support and resistance.
Near-term Keys: The length of HUN’s downward trend, along with the currently increasing pace of bearish momentum in the last week means that taking a short-term, bullish approach is very aggressive; however if you don’t mind being speculative, a push above $25 could be a signal to buy the stock or work with call options, with a target profit price at around $26.50. A drop below $23.50 would act as a strong signal to consider shorting the stock or buying put options, with $22 offering a practical exit target on a bearish trade. The company’s fundamentals could be showing some useful signs of recovery right that make HUN’s value proposition, along with its useful dividend more tempting. I would prefer to wait for confirmation of increasing fundamental strength, along with a stabilization of the stock’s price action before taking a value-driven buying opportunity seriously.