One of the challenges for any investor, no matter what method they prefer to use, is how to find new, useful opportunities to put their money to work for them.
In that effort, one area that I think most investors don’t think about is investing in the companies that make access to the markets possible. I like to keep an eye on the Financial sector, especially as it relates to the ebb and flow of economic activity, and as well as to interest rates. Beyond the investment banks, brokerage houses, and mutual fund companies that I think most of us associate with the Financial sector, however are the companies that manage financial exchanges and track and provide access to all kinds of financial data (on individual companies as well as on the broad market itself).
Nasdaq Inc. (NDAQ) is an excellent example of what I mean; if you track the markets at all, you’ve heard of the NASDAQ and know that it is one of the biggest exchanges in the United States, but you probably didn’t know that for the company that operates that exchange, trading and clearing are just a part of what its overall business does. One of the areas that the company has been putting a lot of recent investment and focus, for example, is on its Investment Intelligence segment, which provides market and index data and analytics for financial institutions. This is an area that operates primarily as a subscription-based service, which provides a high-margin stable operating base as well as some of the company’s best long-term growth opportunities. Another growth area is in the company’s fraud and anti-money laundering solutions, which NDAQ strengthened by acquiring Verafin, a leading anti financial crime technology provider, in early 2021. That business is currently seeing the most success with small banks, with the potential for drawing larger banking customers adding a nice long-term growth opportunity.
The company’s fundamental strengths include healthy free cash flow and operating margins. Those strengths appear to have given the company a useful headwind that allowed it to diverge from the broad market through the second half of 2022, rising from a low that year at around $46.50 to its current, 52-week high at around $69 per share. Since then, the stock has dropped back into a clear downward trend that appears to have found a consolidation level over the past two months between $53 and $56 per share, with the stock currently sitting at the top of that range. Is that mix enough to make the stock a useful value at its current price? Let’s find out.
Fundamental and Value Profile
Nasdaq, Inc. is a global technology company. The Company manages, operates, and provides its products and services in four business segments, including Market Technology, Investment Intelligence, Corporate Platforms, and Market Services. Its Market Technology segment is a global technology solutions provider and partner to exchanges, clearing organizations, central securities depositories, regulators, banks, brokers, buy-side firms, and corporate businesses. The Investment Intelligence segment includes its market data, index, and analytics businesses. The Corporate Platforms segment includes its listing services, and investor relations and environmental, social and governance (IR & ESG) services businesses. The Market Services segment includes its equity derivative trading and clearing, cash equity trading, fixed income and commodities trading and clearing (FICC) and trade management services businesses. It provides broker services, clearing, settlement and central depository services. NDAQ’s market cap is about $27.8 billion.
Earnings and Sales Growth: Over the last twelve months, earnings grew by 5.08%, while sales growth was flat, but slightly negative, at -0.13%. In the last quarter, earnings increased by 7.81%, while sales declined by -3.1%. The company’s margin profile is healthy, and showing some signs of strength that confirms the positive earnings trend; over the last twelve months, Net Income was 18.36%, and 19.7% in the most recent quarter.
Free Cash Flow: NDAQ’s free cash flow was a little over $1.5 billion over the past twelve months and translates to a modest Free Cash Flow Yield of 5.49%. It should be noted that Free Cash Flow has remained relatively stable for the past year, but is also nicely above the $920 million mark seen in the first quarter of 2022.
Dividend Yield: NDAQ’s dividend is $.88 per share, and translates to a yield of 1.57% at its current price. The dividend payout was increased, from $.80 per share, per year following the company’s latest earnings announcement. An increasing dividend is a sign of management confidence and fundamental strength.
Debt to Equity: NDAQ has a debt/equity ratio of 0.77. This is a conservative number that I think is a little misleading. Their balance sheet shows about $627 million in cash and liquid assets. That is a declined from $705 million in the previous quarter, and a little below the $645 million mark of a year ago. The company also reported a little under $4.8 billion in long-term debt. The company’s operating margins and free cash flow indicate debt service isn’t a problem.
Price/Book Ratio: there are a lot of ways to measure how much a stock should be worth; but I like to work with a combination of Price/Book and Price/Cash Flow analysis. Together, these measurements provide a long-term, fair value target around $60.50 per share. That suggests that the stock is slightly undervalued, with about 7.5% upside from its current price, and with a useful discount price at around $48.50.
Technical Profile
Here’s a look at the stock’s latest technical chart.
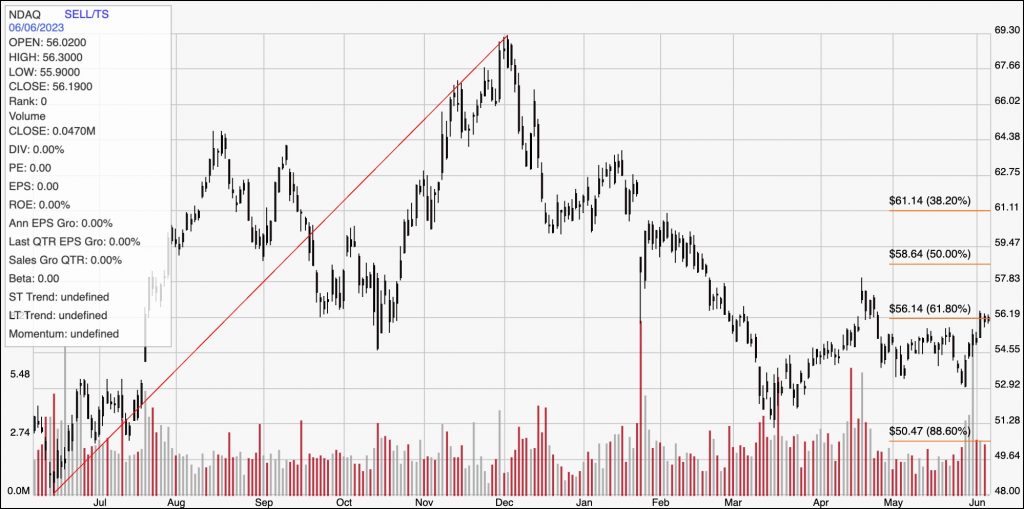
Current Price Action/Trends and Pivots: This chart traces the stock’s movement over the last year. The diagonal red line traces the stock’s upward trend from from its low point in June of last year at around $48 to its December peak at around $69. It also acts as the baseline for the Fibonacci retracement lines shown on the right side of the chart. The stock has dropped back into a clear downward from that point, however it has also stabilized from a downward trend low at around $51 in March. Since the latter part of April, the stock has narrowed its consolidation range to put immediate resistance at around $56 per share, and current support at about $53. Both levels are based on multiple pivot high and low points seen over that period. The stock is right at the top of that range as of this writing, and touching the 61.8% retracement line to confirm that level as immediate resistance. A push above $56 could see the stock rally to about $59.50, a little above the 50% retracement line and based on pivot activity seen in September, October and December of last year as well as January and February. A drop below $53 should find next support at around $51, where the stock’s downward trend low occurred in March.
Near-term Keys: NDAQ has some useful fundamental strengths, including an increasing dividend and healthy profit margins. However, the stock’s current price doesn’t represent a useful value right now, which means that the best probabilities to work with this stock lie in short-term trading opportunities. A push above $56 would be a useful signal to consider buying the stock or working with call options, with $59.50 offering a useful bullish profit target. You could also use a drop below $53 as a signal to think about shorting the stock or buying put options, with $51 acting as a practical profit target on a bearish trade.