No matter what your approach to the stock market may be, there are a myriad number of issues that come at you and demand attention.
Some of those elements can be anticipated, if not predicted; for example, if a company is getting set for a new quarterly earnings report, it’s pretty normal to see a stock’s price become more volatile and to experience wider-than-normal swings from high to low leading up to that date. Other elements are far less predictable, because they are driven by events and issues that fall outside the scope of normal, expected occurrence.
Labor strikes are an example; while they are generally driven by economic and industry factors and issues that are known, they have a way of catching the majority of the investing public and even industry insiders by surprise. Labor strikes decrease production capacity in the short-term, limiting a company’s ability to meet the demand for the products it creates. It can also carry a long-term impact on costs, as labor negotiates for higher pay, improved benefits, and improved working conditions, to name just a few elements often at play, and that generally require a company to allocate more of its budget towards those issues. More often not, those costs carry forward to the consumer level in the form of higher prices for finished goods, or they may force management to defer capital expenses and investments in other important areas of the business.
Kellogg Company (K) is a good example of what I mean. They do a lot more than just cereal, of course, but the truth is that the cereal aisle is where you recognize them the most quickly. It might surprise you to find that U.S. cereal sales, in fact account for approximately 20% of K’s annual sales. Analysts suggest that most of the gains this company, and others in the Food Product industry made during the early stages of the pandemic, driven by eat-at-home trends, have begun to fade. Along with broadly increasing costs of goods that have been just one of the indications of high inflation (and rising interest rates) over the past year, most of those same experts are predicting that tougher times are ahead. I’m less convinced of the dire eat-at-home picture that a lot of experts are painting, simply because I think eating at home becomes even more important during uncertain economic times. When inflation forces consumer prices higher, families look for ways to make their food budget stretch. That makes them more likely to turn to recognized brands that offer reasonable value.
K has also had its share of unanticipated drama. 2021 saw safety issues in the form of fires at cereal plants in Tennessee and in Pennsylvania, along with labor strife that lasted for almost three months and involved about 1,400 unionized workers. In 2022, K made headlines to start the summer following an announcement to split its major business segments into three separate, publicly traded companies. The spinoff is anticipated to be completed later this year, which means that for now, operations remains in place as is, while management works on the transition plan for these businesses to operate independently.
The market generally likes spinoffs because they are viewed as giving management an attractive way to pull additional value from those segments and make them available to investors more easily. For most of last year, K’s stock price enjoyed a nice upward trend, rallying from around $59 in early 2022 to a peak in October at around $77. From that point, the stock dropped into a new downward trend that bottomed in March of this year at around $64. The stock rallied temporarily to a peak in early May at around $71 before dropping back again, and is now nearing that 52-week low. Many of the fundamental strengths that made the stock a big winner through most of last year are still in place, however a rising cost environment has also begun showing its effect on many of my preferred fundamental metrics. Does that mean the stock offers an attractive value at its current price, or is the downward trend a sign of greater risk ahead? Let’s dive in and try to find out.
Fundamental and Value Profile
Kellogg Company is a manufacturer and marketer of ready-to-eat cereal and convenience foods. The Company’s principal products are snacks, such as crackers, savory snacks, toaster pastries, cereal bars, granola bars and bites; and convenience foods, such as, ready-to-eat cereals, frozen waffles, veggie foods and noodles. Its segments include North America, which includes the United States businesses and Canada; Europe, which consists principally of European countries; Latin America, which consists of Central and South America and includes Mexico; and Asia Middle East Africa (AMEA), which consists of Africa, Middle East, Australia and other Asian and Pacific markets. The Company’s snacks brands are marketed under brands such as Kellogg’s, Cheez-It, Pringles, Austin, Parati, and RXBAR. Its cereals and cereal bars are generally marketed under the Kellogg’s name, with some under the Kashi and Bear Naked brands. Its frozen foods are marketed under the Eggo and Morningstar Farms brands. K’s current market cap is $22.6 billion.
Earnings and Sales Growth: Over the last twelve months, earnings growth was flat, at exactly 0%, while revenues increased by 10.4%. In the last quarter, earnings increased by a little more than 17%, while sales were 5.75% higher. The company operates with a generally narrow margin profile that, despite inflationary pressures strengthened in the last quarter; over the last twelve months, Net Income was 5.33% of Revenues, and increased in the last quarter to 7.35%.
Free Cash Flow: K’s free cash flow over the last twelve months is $1.05 billion and translates to a Free Cash Flow Yield of 4.57%. That marks a small decrease from the last quarter, when Free Cash Flow was $1.16 billion, and below $1.3 billion a year ago.
Debt to Equity: K has a debt/equity ratio of 1.29. This is a high number, and makes them one of the most heavily leveraged stocks in the Food Products industry. Their balance sheet indicates that in the last quarter, cash and liquid assets were $347 million, versus $5.76 billion in long-term debt. The quarterly cash number marks a small increase from the last quarter, when cash was $299 million; it should also be noted that the company’s long-term increased by more than $400 million in the last quarter.
Dividend: K’s annual divided is $2.36 per share and translates to a yield of about 3.53% at the stock’s current price. The annual payout was also increased from $2.32 per share in the first half of 2022. An increasing dividend is another sign of management’s confidence in their approach.
Price/Book Ratio: there are a lot of ways to measure how much a stock should be worth; but I like to work with a combination of Price/Book and Price/Cash Flow analysis. Together, these measurements provide a long-term, fair value target at around $69.50 per share, which means that K is only slightly undervalued, with about 7% upside from its current price, and a practical discount price at around $55.50. It should also be noted that this same analysis yielded a fair value target at around $78.50 per share at the start of this year.
Technical Profile
Here’s a look at the stock’s latest technical chart.
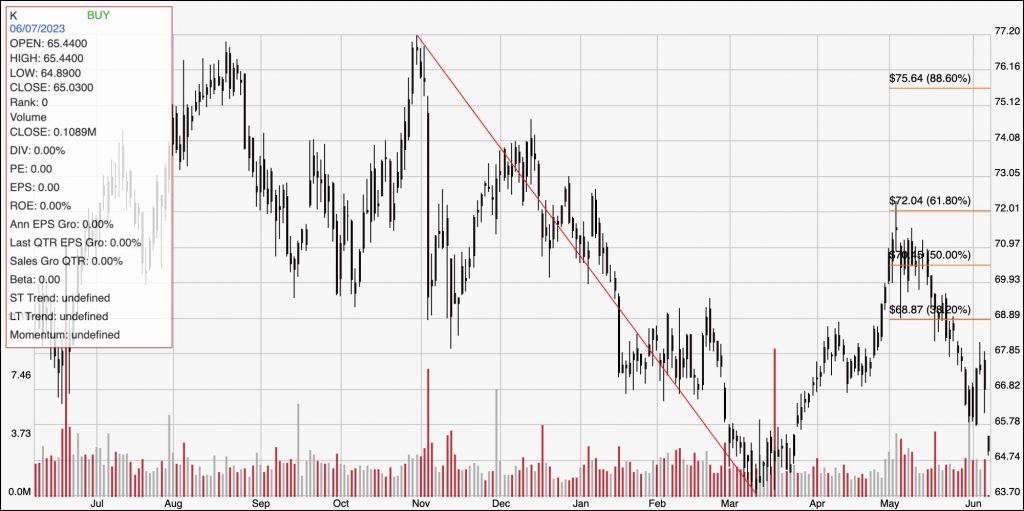
Current Price Action/Trends and Pivots: This chart traces the stock’s movement over the last year. The diagonal red line traces the stock’s downward trend from its high in October of last year at around $77 to its March low at around $64. It also provides the baseline for the Fibonacci retracement lines shown on the right side of the chart. After staging a temporary rally through April to an early May peak at around $71, the stock has dropped back again, and is picking up new bearish momentum over the last couple of days. This morning, the stock dropped below previous support at around $66 to mark immediate resistance at that level, with new, current support expected at around $64 per share. A push above $66 could have short-term upside to about $68, however the current, strong bearish momentum makes that a very low-probability event. A drop below $64 should find next support at around $62 based on the current distance between support and resistance.
Near-term Keys: K’s value proposition, unfortunately isn’t high enough to make the stock a useful, value-driven opportunity, despite the company’s overall fundamental strength. That means that the best probabilities lie in short-term trading strategies. A push above resistance at $66 could be a signal to consider buying the stock or working with call options, using next resistance at around $68 as a practical, quick-hit exit point – but keep in mind that given the current bearish sentiment, that is a very speculative set up with a very low probability of success. A drop below $64 could provide a signal to consider shorting the stock or buying put options, using $62 as a timely profit target on a bearish trade.