The Tech sector has enjoyed the lion’s share of attention among all segments of the economy for a number of years. That’s been a good thing during bull markets, but it also means the sector really gets pummeled when uncertainty increases.
Since 2020, that attention – driven in no small part by the increasingly central role of cloud-based and remote networking solution providers in facilitating remote workforce solutions – motivated investors to buy Tech stocks enthusiastically. The flip side of that attention reared its ugly head over the past year, as higher interest rates, war in Ukraine, and continued supply chain constraints that started with technology rippled into multiple segments of the economy. A lot of Tech companies saw their stock prices plunge this year into their own bear market levels. Over the last few weeks, however, a lot of bullish market attention has shifted back into the sector, with a particular focus on the companies with ties to artificial development and the hardware resources required to make it possible.
Since early 2020, companies that focus on the “enterprise” space – where most corporate tech spending has traditionally gone, for products like servers, computers, printers, and the tools to connect them all in a traditional network setting, for example – have struggled to keep up with demand for remote workforce solutions and cloud-based services. While I think that much of the work-from-home element of corporate operations will become a permanent part of business life, there are also signs that for many businesses, back-in-office is becoming an increasing expectation. My research into many of these companies suggests that while many of the companies that operate in the Enterprise space will continue to be pressured, revenues and earnings in many cases have also begun their own recovery. Current geopolitical, economic and market conditions haven’t entirely been reflected in some of those metrics as of yet, which implies that how elements play into the fortunes of companies in the Tech sector for the rest of this year is a risk element that could act as a longer-term headwind to economic health and growth. On the plus side, AI-driven development is necessarily resource-heavy, and could provide a counter-acting tailwind against those pressures.
That brings us to today’s highlight. Hewlett Packard Enterprise Co. (HPE) is a spin off of Hewlett Packard Corporation (HPQ), and a business that is among those companies that underperformed through most of 2020 but began to build positive momentum beginning in September of 2021, rising from a low at around $13 to a February 2022 peak at nearly $18. From that point, broader market fears pushed the stock into a new downward trend that found its bottom at around $12 in late September of last year. The stock then staged a strong rally that peaked in January at around $17 before beginning a downward trend that bottomed in May a little below $14. AI-fueled bullish momentum has sent the stock soaring since the start of June, hit a parabolic high to start this week at around $18. The real question, of course is whether the speed of the stock’s increase has outpaced the company’s fundamentals, and how that compares against the stock’s current price. Let’s dive in.
Fundamental and Value Profile
Hewlett Packard Enterprise Company (HPE) is an edge-to-cloud platform-as-a-service company. The Company’s segments include Compute, High Performance Compute & Mission-Critical Systems (HPC & MCS), Storage, Advisory and Professional Services (A & PS), Intelligent Edge, Financial Services (FS), and Corporate Investments. The Compute portfolio offers both general-purpose servers for multi-workload computing and workload-optimized servers. HPC & MCS portfolio offers workload-optimized servers designed to support specific use cases. FS provides investment solutions, such as leasing, financing, information technology (IT) consumption, and utility programs and asset management services, for customers that facilitate technology deployment models and the acquisition of complete IT solutions, including hardware, software and services from HPE and others. Corporate Investments include Hewlett Packard Labs, which is responsible for research and development. HPE has a current market cap of $22.2 billion.
Earnings and Sales Growth: Over the past year, earnings declined by 68.42%, while sales increased by 3.87%. In the last quarter, earnings were -15.79% lower, while sales growth was -10.71% lower. The company operated with a narrow margin profile through 2020 that saw big improvements in 2021, but has seen some volatility over the past year. Over the last twelve months, Net Income was 3.46% of Revenues, and strengthened to 5.99% in the last quarter.
Free Cash Flow: HPE’s Free Cash Flow is generally healthy, at about $1.7 billion. On a Free Cash Flow Yield basis, that translates to 7.67%. That marks an increase from the prior quarter, when Free Cash Flow was about $1.2 billion. A year ago, Free Cash Flow was $2.06 billion. The improvement in the last quarter is a good confirmation of the increase seen in Net Income in the last quarter.
Debt to Equity: HPE has a debt/equity ratio of .41, which is a conservative number. Their balance sheet shows about $2.8 billion in cash (compared to $2.5 billion a quarter ago, but a little less than $4.2 billion nine months ago) against a little over $8.3 billion in long-term debt. Their operating profits are adequate to service their debt, with healthy financial flexibility as well. It’s also worth noting that a little over a year ago, long-term debt was around $10.2 billion, meaning that the company has eliminated about $2 billion of long-term debt from their balance in that period.
Dividend: HPE pays a dividend of $.48 per share, which translates to an annual yield of about 2.82% at the stock’s current price. I think that it is also noteworthy that the company has not cut or reduced their dividend; in fact it remains a bit above the $.44 per share payout they maintained until the beginning of 2020, when management increased the dividend to its current level.
Price/Book Ratio: there are a lot of ways to measure how much a stock should be worth; but I like to worth with a combination of Price/Book and Price/Cash Flow analysis. Together, these measurements provide a long-term target a little below $16 per share. That suggests that the stock is overvalued, with about -8% downside from its current price, and a useful discount at around $12.50. It is also worth noting that at the beginning of 2023, this same analysis yielded a long-term target price at around $19.50 per share.
Technical Profile
Here’s a look at the stock’s latest technical chart.
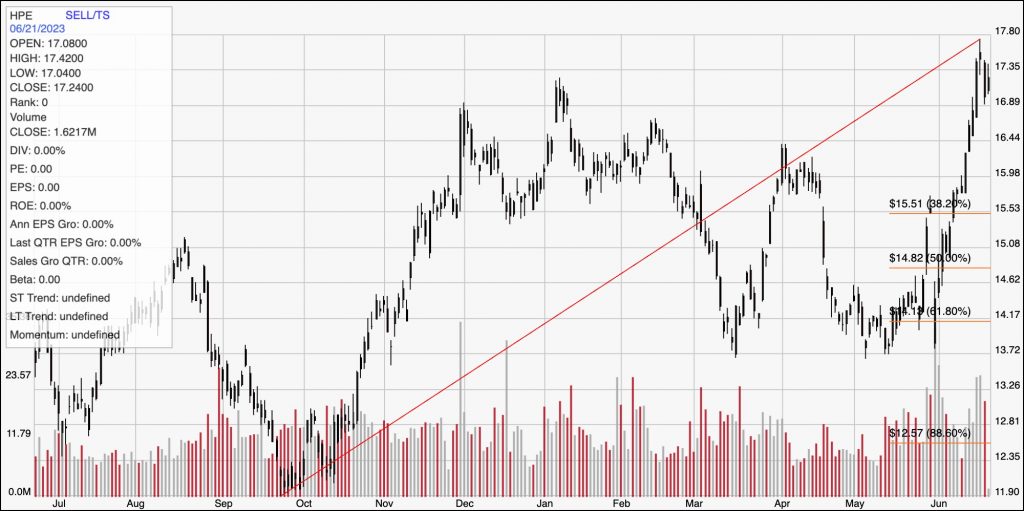
Current Price Action/Trends and Pivots: The chart above displays the last year of price activity for HPE. The red diagonal line traces the stock’s upward trend from a low in September of last year at around $12 to its high, set at week ago at around $18. It also provides the baseline for the Fibonacci retracement lines shown on the right side of the chart. The stock’s bullish momentum has accelerated in the last three weeks to a degree that is hard to see as sustainable, suggesting that the stock should continue to retrace off of that 52-week high, which also marks immediate resistance at around $18 to where current support should be found at around $16.50. A push above $18 should find next resistance at around $19.50, based on the current distance between support and resistance, while a drop below $16.50 should find next support at around $15.50 where the 38.2% retracement line sits.
Near-term Keys: HPE’s latest surge and parabolic, bullish momentum should give anyone that prefers short-term trading strategies reason to think twice about taking a bearish position. A bounce off of support at around $16.50, however could be a good signal to consider buying the stock or working with call options, with the stock’s 52-week high at around $18 providing a good initial profit target and $19.50 possible if buying momentum continues. The stock’s rally, however, has clearly pushed the stock’s price past the point of useful value. Keep the stock in a watchlist, and look for the stock to retrace its price a bit before considering taking a long-term position.