It’s getting harder to find good values under current market and economic conditions.
When sustained, high inflation pushes interest rates to a certain point, it gets harder for companies to sustain earnings and profit margin growth as input costs keep increasing. That doesn’t mean good values can’t be found, but it does mean that they often tend to be localized in sectors and industries that are less susceptible to the ebb and flow of interest rates and other economic conditions.
This year, the best bargains have become more and more focused on just a couple of sectors of the market. I’ve had the most success this year mining the Energy sector as well as the Banking industry. Banking is an interesting nut to crack, because there is a clear demarcation point between the largest players in the industry and smaller, but still relatively well-known regional banks. Early this year the highly publicized failure of banks like Silicon Valley Bank and Signature Bank, for example put a lot of pressure on the entire industry. That pushed most banking stocks to historical levels that have produced the kind of valuation levels I like to work with. It also started bring the highest-quality companies to the head of the pack.
I’ve found some of the best bargains among regional players, but also useful investments among a select few of the biggest national banks in the U.S. One of the real tricks to being able to keep your money working for you no matter what the broader economy and market’s trend is doing is being able to recognize that opportunities exist in every kind of cycle. I was reminded about that not too long ago while listening to a few analysts talking about current market conditions. The discussion closed with the moderator asking these experts where each one thought some of the smartest places to put their money right now would be. It wasn’t too surprising when a couple of them singled out the financial sector.
The premise is simple enough: rising rates are good for fixed-income investors, because they can get a higher yield on “safer” investments like bonds and short-term instruments. That’s usually just one piece of positive news for banks, as they see increased volume in bond purchases as well as flows into shorter-term instruments like money markets, Treasury bills, and certificates of deposit. That also gives them more money to offer to borrowers at higher interest rates, which often means that while other parts of the market are experiencing turbulence and increased volatility, financial stocks like banks become part of the “flight to quality” that are often typical of the end of a bull market.
It is a bit of a double-edged sword, however; rising interest rates can only continue for so long before the economy inevitably begins to slow, because at some point interest rates become high enough that borrowing becomes prohibitively expensive – which is where I think we’re arriving now. That means that if you want to watch the financial sector right now, it’s smart to keep a cautious eye, and to look for stocks that represent an excellent value.
Citigroup Inc. (C) is one of the biggest banks in the U.S., and offers an interesting example. The stock has been a bit volatile for most of the year, moving from a yearly high in August of last year at around $54.50 to a low just two months later at around $40, with a trading range that started the year between $52 at the high end and $43 on the low side. Lately the stock’s trading range has narrowed, with the stock sitting close to support at around $44.50 and a few dollars below its latest high around $49. Does that make C a potentially attractive bargain at its current price? Do the company’s fundamentals make C a stock that is worth investing your hard-earned dollars right now? You decide.
Fundamental and Value Profile
Citigroup Inc. (Citi) is a financial services holding company. The Company’s whose businesses provide consumers, corporations, governments and institutions with a range of financial products and services, including consumer banking and credit, corporate and investment banking, securities brokerage, trade and securities services and wealth management. The Company operates through two segments: Citicorp and Citi Holdings. Citicorp is the Company’s global bank for consumers and businesses and represents its core franchises. Citicorp is focused on providing products and services to customers and leveraging the Company’s global network, including various economies. As of December 31, 2016, Citicorp was present in 97 countries and jurisdictions, and offered services in over 160 countries and jurisdictions. Global Consumer Banking (GCB) provides traditional banking services to retail customers through retail banking, including Citi-branded cards and Citi retail services. C has a current market cap of $90.1 billion.
Earnings and Sales Growth: Over the last twelve months, earnings decreased -7.92%, while sales increased almost 75%. In the last quarter, earnings increased by a little more than 69%, while sales grew by 23.16%. The company’s Net Income versus Revenue tells an interesting story, since over the last twelve months it was 19.52%, but in the last quarter weakened to 12.28%. That implies that while profit margins are still generally healthy, the company is seeing those margins decrease.
Free Cash Flow: C’s Free Cash Flow is relatively minimal, at about $2.15 billion. This is a number that has declined over the past year, from $29.7 billion, and $19.5 billion in the quarter prior. The current number translates to a Free Cash Flow yield of 2.38%.
Debt to Equity: C has a debt/equity ratio of 1.48, which appears high, but it should be noted that most banks carry higher debt levels as a normal course of their business. Despite the high debt/equity ratio, the company’s cash and liquid assets as of the last quarter are more than 3 times higher – at nearly $1.1 trillion – than the total amount of long-term debt on their balance sheet ($279.6 billion).
Dividend: C pays an annual dividend of $2.04 per share, which at its current price translates to a dividend yield of about 4.41%.
Price/Book Ratio: there are a lot of ways to measure how much a stock should be worth; but I like to worth with a combination of Price/Book and Price/Cash Flow analysis. Together, these measurements provide a long-term target at about $66.50 per share. That suggests that the stock is quite undervalued right now, with nearly 44% upside from its current price.
Technical Profile
Here’s a look at the stock’s latest technical chart.
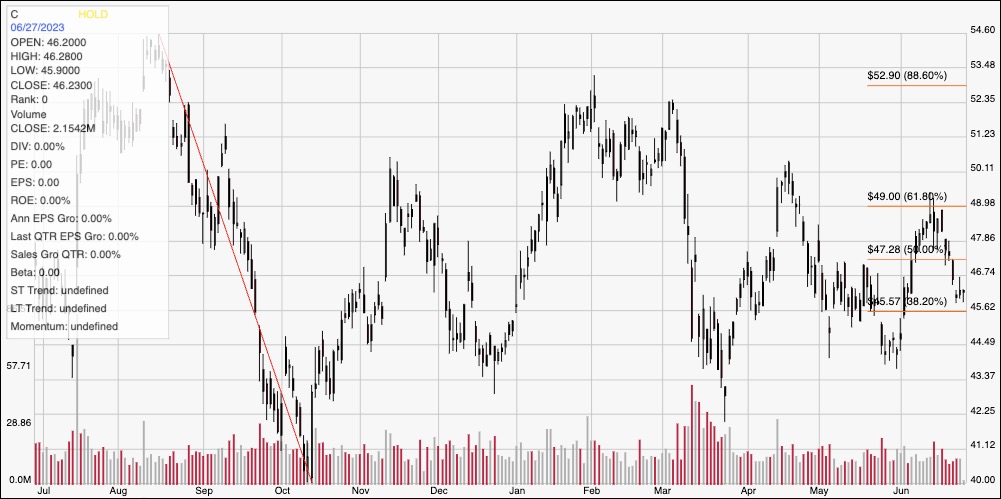
Current Price Action/Trends and Pivots: The chart above displays the stock’s price action for the last year. The red diagonal line, tracing a rapid downward trend from an August peak at around $54.50 to its low in October of last year at around $40, also provides the baseline for the Fibonacci retracement lines on the right side of the chart. The stock is approaching expected, current support at around $45.50 where the 38.2% retracement line sits, with immediate resistance at around $47. A push above $47 should see near-term upside to about $49, where the 61.8% retracement line waits, while a drop below $45.50 should find next support at around $43.50, based on the stock major pivot low in late March.
Near-term Keys: If you prefer to work with short-term trading strategies, an interesting signal could come from a bounce off of current support at around $45.50, with immediate upside to $47, and $49 if bullish momentum accelerates. A drop below $45.50, on the other hand could act as a signal to consider shorting the stock or buying put options, with a practical exit target at around $43.50 on a bearish trade. While the stock offers a tempting value proposition, I think there are enough warnings signs, including minimal free cash flow and weakening profit margins to keep an eye out for improvement in these metrics before taking its value proposition seriously. The truth is that there are a number of competitors with a better combination of fundamental strength and useful value proposition to work with right now.