One of the core principles about technical analysis that was drilled into my head early in my investing career is that “the market is always right.”
It’s one of those idioms that is good as sound bite. It’s also useful in building a disciplined investing mindset, because it’s designed to disconnect a person’s bias about a company from the investing decision and instead to learn to rely on the stock’s price action to drive a more objective approach to trade timing as well as what kind of trade to make – buy, sell, or stay away.
Early in my investing career, I put a lot of focus on understanding technical concepts like identifying short-term reversal points as support and resistance, trend formations over time, and how all of that information can be applied against a stock’s current price to recognize signals about a stock’s likely direction across multiple time periods in the future. Those principles put “the market is always right” into a clearer context and made it easier to separate whether or not I liked the company or their core business from a practical investing decision.
For some, the mindset I just outlined tends to dismiss the value argument, which relies on the company’s underlying fundamental strength to drive an evaluation about what the stock should be worth. Pure technicians operate on the basis that the market prices all available information about a company into its stock at all times, no matter whether that information is qualitative, quantitative or otherwise. That means that whatever a stock’s price is today, that is where it probably should be. It’s why swing and momentum traders don’t care so much about what a stock’s price is right now as much as which way it’s going, and what that direction might say about where it is likely to go next.
In the years since I cut my teeth on those technical concepts, I’ve studied and learned more about fundamental and value-based principles. Along the way, I’ve learned to combine the best of both the technical and fundamental viewpoints into the system I use now. Understanding where a stock is right now in relation to its trends helps to shape my viewpoint about the probabilities of also identifying stocks at useful valuation levels. Sometimes, those principles work well in concert with each other and at other times they seem diametrically opposed. The longer a bull market lasts, for example, the harder it gets to find stocks with the ideal combination of a value and fundamental-driven discount with a trend that leads me to also believe potential downside could be limited.
The Financial sector is a good example of what I mean. From early in 2020 until the beginning of 2022, the sector was one of the biggest stars of the market. As interest rates have increased this year, however, the opposite has held true, as the sector dropped nearly -30% from its January high to its October low as measured by the U.S. Financials iShares ETF (IYF). From that point, however, the sector has picked up positive momentum that has pushed a lot of financial stocks higher. More recently, uncertainty increased around regional banks, fueled by the highly publicized failures of Silicon Valley Bank and Signature Bank in the first quarter of this year. The opportunity that brings for value-oriented investors is that while regional bank-focused market uncertainty may remain, it’s also become clear that there are a number of regionals that sit on very solid footing, with valuations that now sit at compelling levels.
That brings me to an interesting company with a focus on the Southeastern and Mid-Atlantic area of the United States, Truist Financial Corporation (TFC). While this company doesn’t get a lot of media attention when talking heads start talking about the largest banking institutions in the U.S., it is the 7th largest commercial bank in the U.S. by deposits. They boast a very healthy balance sheet with healthy liquid reserves, increasing cash flow and a healthy dividend that makes tempting fodder for income-seeking investors. The stock dropped from a January high at around $53.50 to a May low at around $25.50, then began rallying to its latest peak at around $33 earlier this month. The stock has retraced from that high again, not sitting right around $30. That’s a steep decline in price that would be likely to chase away growth investors, but along with the fundamentals, looks like it could spell a really useful value-driven opportunity right now. Let’s dive in to the details.
Fundamental and Value Profile
Truist Financial Corporation is a financial services company. The Company operates through its commercial bank subsidiary, Truist Bank (the Bank). The Bank provides a range of banking and trust services for clients and its digital platform. The Company’s segments include Consumer Banking and Wealth, Corporate and Commercial Banking, and Insurance Holdings. It provides a range of banking services to commercial and consumer clients, which includes asset management, automobile lending, credit card lending, consumer finance, home equity lending, insurance, investment brokerage services, mobile/online banking, payment solutions, retail deposit products, small business lending and student lending. Its services also include commercial deposit and treasury services, commercial finance, commercial lending, floor plan lending, leasing, investment banking and capital markets services, institutional trust services, international banking, insurance premium finance and supply chain financing. TFC’s market cap is about $40.5 billion.
Earnings and Sales Growth: Over the last twelve months, earnings declined by -11.4%, while sales were about 45.8% higher. In the last quarter, earnings shrank by -16.15% while sales were about 7.4% higher. TFC’s margin profile is very healthy, but is showing some signs of weakness; Net Income as a percentage of Revenues was 22.81% over the last twelve months, and dropped in the last quarter to 18.87%.
Free Cash Flow: TFC’s free cash flow was about $10.8 billion over the past twelve months and translates to a Free Cash Flow Yield of 26.65%. It has also increased over the past year, from $8.1 billion.
Dividend Yield: TFC’s dividend is $2.08 per share, and translates to yield of 6.82% at its current price. Management increased the dividend payout last summer, from $1.92 per share, which further confirms the company’s overall fundamental strength.
Debt to Equity: TFC has a debt/equity ratio of 1.25. This looks high, but isn’t unusual for banking stocks. Their balance sheet shows $45.8 billion in cash and liquid assets against about $69.9 billion in long-term debt. It should be noted that cash increased by nearly $15 billion in the last quarter, while long-term debt also increased by more than double. Despite the increase in debt, the company is in an excellent financial position with very high liquidity, and operating margins that make debt service very manageable.
Price/Book Ratio: there are a lot of ways to measure how much a stock should be worth; but I like to work with a combination of Price/Book and Price/Cash Flow analysis. Together, these measurements provide a long-term, fair value target at around $46.50 per share. That means the stock is nicely undervalued, with about 55% upside from the stock’s current price.
Technical Profile
Here’s a look at the stock’s latest technical chart.
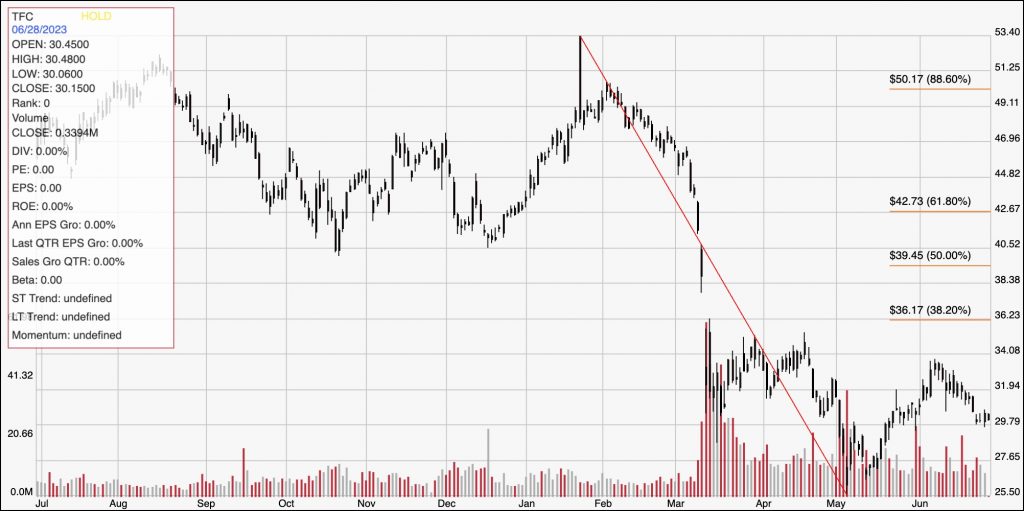
Current Price Action/Trends and Pivots: This chart traces the stock’s movement over the last year. The diagonal red line traces the stock’s downward trend from a high at around $53.40 in late January to its low in May at about $25.50. It also provides the baseline for the Fibonacci retracement lines shown on the right side of the chart. From that May low, the stock rallied to its latest major pivot high at around $33.50, and has retraced from that point to its current level at around $39, where it has been hovering for the last few days and appears to be setting current support. I have immediate resistance at $32, a little below the last pivot high and based on pivot activity in that price area in March and April. A push above $32 will find next resistance between $33.50 and $34, but increased buying momentum around those levels could see the stock push as high as $36, where the 38.2% retracement line sits. A drop below $30 could see the stock retest its yearly low at around $25.50.
Near-term Keys: TFC offers a very tempting value proposition, and when you combine that will a generally very solid fundamental profile and very attractive dividend, this is a stock that I think represents a useful investing opportunity under current market conditions. If you prefer to focus on short-term trading strategies, a push above $32 could provide an interesting signal to buy the stock or work with call options, with $33.50 providing a practical, initial bullish profit target, and $36 possible if buying activity increases. A drop below $30 could be a signal to short the stock or buy put options, using $25.50 as a practical profit target on a bearish trade.