One of the interesting things about the market is the reality that not all areas of the market offer good opportunities at the same time.
That fact is one of the reasons that, as both an analyst and individual investor, I’ve always found the stock market so interesting. Learning to recognize that different sectors and even industries respond differently to the various pressures that impact economic activity, as well as when useful divergences occur, is a big part of what makes it possible to keep finding useful, value-oriented investments. No matter what broader economic and market conditions may be doing, there are always areas of the market to work with.
The Financial sector is an interesting example of what I mean right now. Persistently high inflation, including robust employment numbers in a rising interest rate environment should generally mean that Financial companies struggle. In Banking, for example, rising interest rates naturally blunt demand for commercial, residential and consumer lending. More recently, uncertainty increased around regional banks, fueled by the highly publicized failures of Silicon Valley Bank and Signature Bank in the first quarter of this year, which in both cases had at least portions of their demise attributed to the impact of high interest rates on their own operations. The opportunity that brings, perhaps a little bit ironically, for value-oriented investors is that while regional bank-focused market uncertainty may remain, it’s also become clear that there are a number of regionals that sit on very solid footing, with valuations that now sit at compelling levels. It’s been enough to prompt me to expand my analysis of regional banks in this sector, with some very interesting results so far.
With that, today’s post focuses on a regional U.S. bank that focuses on the Midwestern and Southeastern areas of the country, Fifth Third Bancorp (FITB). While this company doesn’t get a lot of media attention when talking heads start talking about the largest banking institutions in the U.S., it is notable as being less susceptible to deposit pressures, and has even seen growth in both consumer and business lending. They boast a very healthy balance sheet with healthy liquid reserves, manageable debt, increasing cash flow and a healthy dividend that makes tempting fodder for income-seeking investors. The stock dropped from a February peak at around $38 to a March low at around $22, and has been hovering since in a sideways trend a few dollars above that low. Are the company’s fundamental strong enough to suggest that the latest decline in price signals a good value-driven opportunity? Let’s find out.
Fundamental and Value Profile
Fifth Third Bancorp (the Bancorp) is a bank holding company for Fifth Third Bank, National Association. The Bancorp conducts its principal lending, deposit gathering, transaction processing and service advisory activities through its banking and non-banking subsidiaries from banking centers located throughout the Midwestern and Southeastern regions of the United States. The Bancorp operates through three segments: Commercial Banking, which offers credit intermediation, cash management and financial services to large and middle-market businesses and government and professional customers; Consumer and Small Business Banking provides a full range of deposit and loan products to individuals and small businesses through a network of full-service banking centers and relationships with indirect and correspondent loan originators, and Wealth and Asset Management, which provides a range of wealth management services for individuals, companies and nonprofit organizations. FITB’s market cap is about $40.5 billion.
Earnings and Sales Growth: Over the last twelve months, earnings increased by 13%, while sales were about 47.5% higher. In the last quarter, earnings shrank by -25% while sales were about 3.5% higher. FITB’s margin profile is very healthy, but is showing some signs of weakness; Net Income as a percentage of Revenues was 24.39% over the last twelve months, and dropped in the last quarter to 19.18%.
Free Cash Flow: FITB’s free cash flow was about $5.6 billion over the past twelve months and translates to a Free Cash Flow Yield of 31%. It has also increased over the past year, from $4.9 billion.
Dividend Yield: FITB’s dividend is $1.32 per share, and translates to yield of 5.01% at its current price. Management increased the dividend payout last summer, from $1.20 per share, which further confirms the company’s overall fundamental strength.
Debt to Equity: FITB has a debt/equity ratio of .79, which is a relatively low, manageable number. Their balance sheet shows $13.7 billion in cash and liquid assets against about $12.9 billion in long-term debt. It should be noted that cash increased by about $1.5 billion in the last quarter, while long-term debt decreased by almost $1 billion. Along with their healthy operating margins and strong Free Cash Flow, the company is in an excellent financial position with very high liquidity, giving them excellent financial flexibility.
Price/Book Ratio: there are a lot of ways to measure how much a stock should be worth; but I like to work with a combination of Price/Book and Price/Cash Flow analysis. Together, these measurements provide a long-term, fair value target at around $38 per share. That means the stock is very undervalued, with about 43% upside from the stock’s current price.
Technical Profile
Here’s a look at the stock’s latest technical chart.
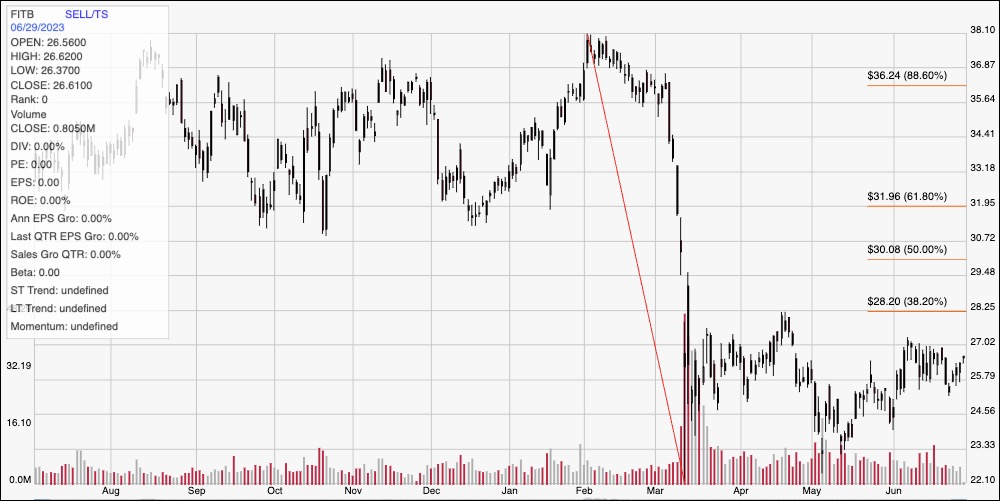
Current Price Action/Trends and Pivots: This chart traces the stock’s movement over the last year. The diagonal red line traces the stock’s downward trend from a high at around $38 in to start February to its low in March at about $22. It also provides the baseline for the Fibonacci retracement lines shown on the right side of the chart. After rallying to about $28 in late April, the stock dropped back again, finding bottom at around $23 in May and building gradual, bullish momentum to about $27 to start June. The stock has been hovering between immediate resistance at $27 and current support at around $25 since then. A push above $27 should find next resistance at $28, right around the 38.2% retracement line, however a push above that point should have room to see the stock rally to about $31 before finding its next resistance level. A drop below $25 should find next support at around $23, based on the stock’s last major pivot low in May.
Near-term Keys: FITB offers a very interesting value proposition, and when you combine that with a very solid fundamental profile and very attractive dividend, this is a stock that I think represents a useful investing opportunity under current market conditions. If you prefer to focus on short-term trading strategies, a push above $28 could provide an interesting signal to buy the stock or work with call options, with $31 providing a practical, initial bullish profit target. A drop below $25 could be a signal to short the stock or buy put options, using $23 as a practical profit target on a bearish trade.