When the uncertainty keeps broad segments of the economy on edge, it can be hard to find industries that won’t be affected.
The Food Products industry in the Consumer Staples sector is an area of the market that tends to get overlooked because it just isn’t very sexy. It doesn’t get talked about much on market media channels, because Food stocks rarely translate to impressive growth. It especially gets dismissed when market conditions start to turn more bullish, as investors gravitate to the sectors and industries showing the fastest growth. Despite that, this is an industry that I like to keep on my radar, both as a good place to find contrarian-minded, underrated (read: undervalued opportunity) opportunities as it is a barometer for the fundamental health of the economy. That second purpose becomes increasingly relevant the longer interest rates remain high and consumer prices continue to rise.
“Stickiness” is a term, borne out of the pandemic, that is frequently applied to the Food Products industry. It implies that the longer consumers rely on cooking and eating at home, the more likely that behavior is to become ingrained. That doesn’t mean we as consumers don’t appreciate the opportunity to go out and enjoy the socialization associated with restaurants, theaters, and so on. Even so, I think food-at-home is something that will “stick” as a natural behavior for fiscally conservative families, as much as anything because the of reality of inflation and the impact of rising consumer prices on a typical family budget. Even if the “bull case” that some experts are hoping for as a result of rising interest rates comes to pass – meaning, a moderate, but not severe recession that lines up with the Fed’s comments about targeting a “soft landing” for the economy – that means higher unemployment, and higher consumer prices that will keep pressure on family finances. I believe that means that families will be forced to focus their budgets on brands in the Food Products industry that emphasize value.
Another interesting layer of Food Products business relates to pets. Pet food is a highly competitive segment of the Food Products industry, and something that analysts like to point to as a differentiating part of a diversified Food Products company portfolio. An increase in demand for pet food has translated to healthy stickiness owing to increases in new pet adoptions over the most of the last three years. Makes sense, doesn’t it? The fact is the last three years have made the emotional support offered by a cuddly puppy or kitty more compelling for children and adults alike. That means that the Food Products companies that have pet food and pet products as part of their business portfolio have a useful second leg to differentiate themselves from the competition and keep revenues healthy on a long-term basis.
General Mills, Inc. (GIS) is a stock that I’ve followed for quite some time, and even used on a few different occasions over the last couple of years in my value-based, income-oriented investments. Its usefulness as a defensive position was proven out in 2020, as the stock dropped only about -10% during the initial broad market push to bear market levels, but then pushed more than 22% above its pre-pandemic highs by the beginning of August of 2021. For all of 2022, the stock staged an impressive increase of more than 24%, and hit a new 52-week high in mid-December at around $88.50. After dropping off of that high to start 2023, the stock started a new rally in February that saw it peak above %90 in May. It’s been picking up bearish momentum since then, dropping down to its current price at around $77. What does that say about its current value proposition? Let’s find out.
Fundamental and Value Profile
General Mills, Inc., is a manufacturer and marketer of branded consumer foods and pet food products sold through retail stores. The Company is a supplier of branded and unbranded consumer food products to the North American foodservice and commercial baking industries. It also provides pet food products through its subsidiary Blue Buffalo Pet Products Inc. The Company has four segments: U.S. Retail, International, Pet operating, and Convenience Stores and Foodservice. The Company offers a range of food products with a focus on categories, including ready-to-eat cereal; convenient meals, including meal kits, ethnic meals, pizza, soup, side dish mixes, frozen breakfast and frozen entrees; snacks, including grain, nutrition bars and frozen hot snacks; yogurt, and super-premium ice cream. The Company’s other product categories include baking mixes and ingredients, and refrigerated and frozen dough. It also provides food products for dogs and cats. GIS’s current market cap is about $45 billion.
Earnings and Sales Growth: Over the last twelve months, earnings growth was flat, at exactly 0%, while revenues were 2.84% higher. In the last quarter, earnings increased by almost 15.5%, while sales growth was -1.87% lower. GIS operates with a healthy margin profile that is reflects pressure from the broader, inflationary environment; over the last year, Net Income was 12.91% of Revenues, and weakened in the last quarter to 12.22%.
Free Cash Flow: GIS’s free cash flow is generally healthy, at about $2.1 billion, and translates to a modest Free Cash Flow Yield of 4.61%. This marks a decline over the past year, when Free Cash Flow was about $2.9 billion.
Dividend Yield: GIS’s dividend is $2.36 per share, and translates to an annual yield of about 3.06% at the stock’s current price. It is also worth noting that the company increased their dividend in 2020 – a rarity in the market at the time – from $1.96 per share, again from 2.04 per share in mid-2022, and $2.16 per share after the most recent earnings announcement. GIS is also one of a very select number of companies, having paid an uninterrupted dividend for 122 years. Think about that for a moment; this is a company that has prioritized returning value to its shareholders via dividend payout, and maintained that discipline for more than a century. That’s a period spanning two world wars, two pandemics, and multiple global financial crises including the Great Depression, the Great Recession of 2008, and the initial, overwhelmingly bearish start of 2020.
Debt to Equity: GIS has a debt/equity ratio of 0.93. High debt/equity is pretty typical of stocks in the Food Products industry, and in this case GIS’ ratio has increased, from .78 in the last quarter. Their balance sheet shows modest liquidity; in the last quarter, cash and liquid assets were $585.5 million. This number was about $532.7 million at the beginning of 2019 and $626 million in February 2020 before the pandemic began, but rose to $2.75 billion in the first quarter of 2021 and was $844 million in early 2022. They also currently have about $9.9 billion of long-term debt (versus $8.1 billion in the quarter prior). The company’s margin profile and free cash flow indicate that debt service isn’t a problem, however the increase in debt, while free cash flow is shrinking and liquidity is limited is something on which to keep a careful eye.
Price/Book Ratio: there are a lot of ways to measure how much a stock should be worth; but I like to worth with a combination of Price/Book and Price/Cash Flow analysis. Together, these measurements provide a long-term target at about $68.50 per share. That suggests GIS is overvalued by about -11%, with a practical bargain price for the stock at around $55 per share.
Technical Profile
Here’s a look at the stock’s latest technical chart.
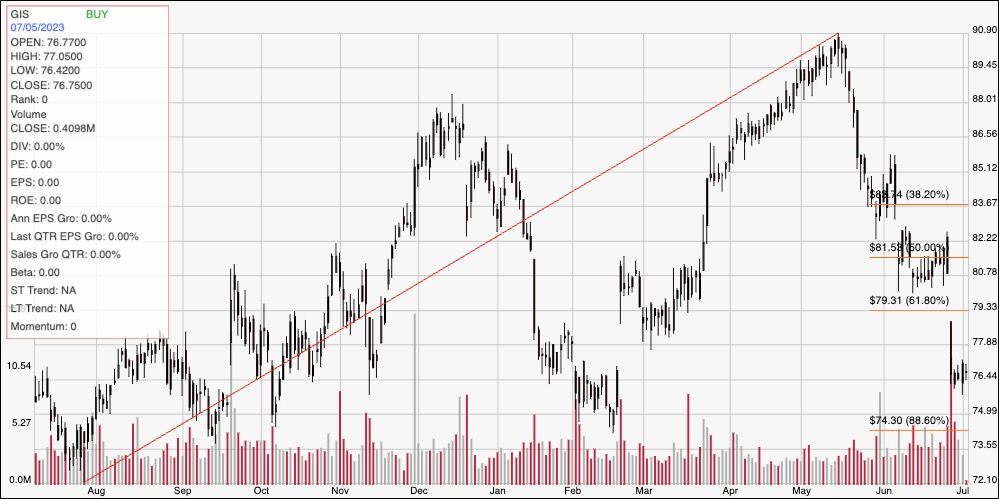
Current Price Action/Trends and Pivots: This chart traces the stock’s movement over the last year. The red diagonal line marks the stock’s upward trend from a July 2022 low at around $72 to its May high at about $91. It also provides the baseline for the Fibonacci retracement lines shown on the right side of the chart. The stock has picked up bearish momentum from that peak, falling rapidly to a low in June at around $81, and then gapping lower overnight after the last earnings announcement. The stock appears to have found current support at around $76.50, based on the stock’s stabilization at that level over the last week. Immediate resistance is at about $78, based on pivot activity seen in that range in February and March. A push above $78 should find next resistance at around $81, where the stock stabilized in June, while a drop below $76.50 should find next support at around $74, near the 88.6% retracement line.
Near-term Keys: If you’re looking for a short-term, bullish trade, and you’re willing to be very aggressive, you could use a push above $78 as an opportunity to buy the stock or work with call options, using $81 as a useful profit target. A drop below $76.50, on the other hand could work as a signal to consider shorting the stock or buying put options, with a useful, conservative target price at around $74 on a bearish trade. From a fundamental, value-oriented perspective, GIS fundamentals are a bit mixed, with enough concerns to accept the fact that the stock doesn’t offer a useful value proposition at its current price.