Like most investors, I’ve always looked at the market, at least partially, through the lens of my own personal and professional experience.
As a self-described nerd with a lot of experience and education in software and technology, it’s pretty natural for me to gravitate to stocks in tech-driven industries. The Technology sector has been a major driver of economic growth since 2020, and in fact is typically at the head of the pack in driving market movements. That’s been true throughout most of the past three years as well, but driving at the front of the pack over the last year or so means that the Tech sector has been leading market uncertainty and volatility. Many of the most well-known names in the sector, and in industries like Semiconductors have seen wide swings from high to low and back again as investors fret over issues like supply chain, rising interest rates, and trade tension between then U.S. and China amid a rising push to reduce Western reliance on Asia for chip and semiconductor production.
The Semiconductor industry, specifically is one that I’ve learned to pay a lot of attention to, simply because the companies in this industry produce the products that drive innovation in practically every other sector of the economy. Want to talk about 5G? Memory chips in smartphones and other mobile devices are a small piece of Semiconductor’s place in future mobile Web connectivity. Self-driving cars, electric vehicles? “Smart” home appliances? Guess what – they all rely on semiconductors to one extent or another. That puts Semi stocks some of the most interesting companies in the market, from my view.
Micron Technology, Inc. (MU) is a leading company in the Semiconductor industry, and are most known for their memory products, such as DRAM, NAND, and Flash solutions for solid-state hard drives and memory modules. The stock followed the rest of the Tech sector lower in 2022, dropping from a December 2021 high at around $98.50 to a low at around $48.50 in late December of 2022. From that low point, the stock rallied strongly on the heels of AI-driven Tech enthusiasm to a peak in late May at around $75 per share. Since then, the stock has faded back again to its current price a little above $60. What does that say about the stock’s value proposition? Are the company’s fundamentals strong enough to to suggest this latest drop could translate to a useful bargain-buying opportunity? Let’s dive in.
Fundamental and Value Profile
Micron Technology, Inc. (MU) is engaged in semiconductor systems. The Company’s portfolio of memory technologies, including dynamic random-access memory (DRAM), negative-AND (NAND) Flash and NOR Flash are the basis for solid-state drives, modules, multi-chip packages and other system solutions. Its business segments include Compute and Networking Business Unit (CNBU), which includes memory products sold into compute, networking, graphics and cloud server markets; Mobile Business Unit (MBU), which includes memory products sold into smartphone, tablet and other mobile-device markets; Storage Business Unit (SBU), which includes memory products sold into enterprise, client, cloud and removable storage markets, and SBU also includes products sold to Intel through its Intel/Micron Flash Technology (IMFT) joint venture, and Embedded Business Unit (EBU), which includes memory products sold into automotive, industrial, connected home and consumer electronics markets. MU’s current market cap is $66.9 billion.
Earnings and Sales Growth: Over the last twelve months, earnings declined by -163%, while revenues decreased by -56.6%. In the last quarter, earnings were 22.66% higher, while sales increased by 1.6%. The company’s operating profile has narrowed dramatically throughout the past year; Net Income was about -16% of Revenues a year ago on a trailing twelve-month basis, with significant deterioration in the last quarter, to -50.5%. These strongly negative Net Income numbers are an alarming reminder that inflation and rising interest rates are cutting into the bottom lines in just about every sector of the economy.
Free Cash Flow: MU’s free cash flow, like Net Income, is strongly negative, at -$4.7 billion in the last year, and has been declining steadily over the same period, from $4 billion a year ago. This is a confirmation of the negative Net Income picture I previously described.
Debt to Equity: MU has a debt/equity ratio of .29. This number reflects the company’s manageable debt levels, however it should be noted that it has also increase, from .2 at the end of 2022. The company’s balance sheet is a source of strength, with $10.3 billion in cash and liquid assets versus debt of almost $13 billion. It should be noted that a year ago, long-term debt was just $6.8 billion.
Dividend: MU’s dividend is $.46 per share, per year, and which translates to a minimal yield of 0.75% at the stock’s current price. While the dividend may not sound impressive, management did increase the dividend payout from $.40 per share in July 2022. An increasing dividend – on even a conservative basis – is a strong sign of management confidence.
Price/Book Ratio: there are a lot of ways to measure how much a stock should be worth; but I like to work with a combination of Price/Book and Price/Cash Flow analysis. Together, these measurements provide a long-term, fair value target around $32.50 per share. That suggests that at its current price, MU is significantly overvalued, with -47% downside from its current price, and a practical bargain price at around $26.
Technical Profile
Here’s a look at the stock’s latest technical chart.
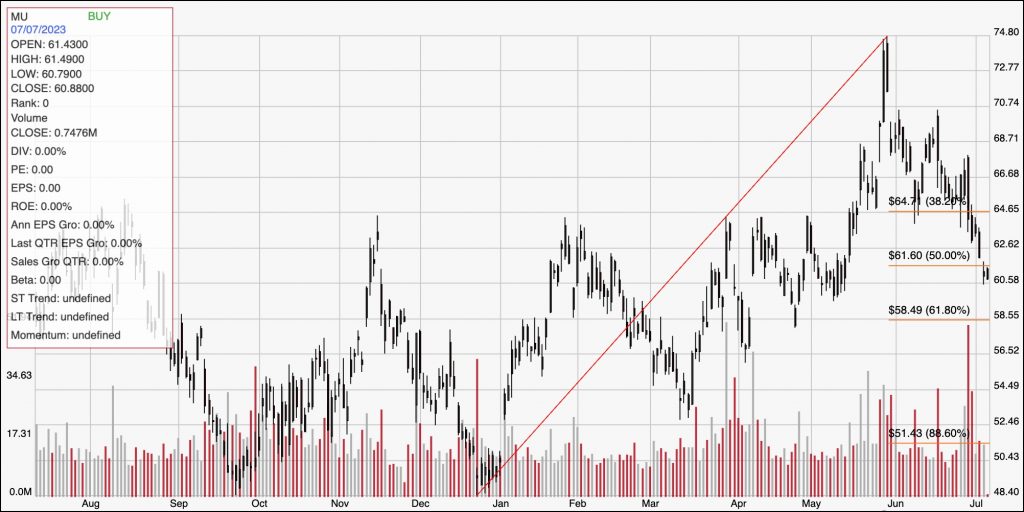
Current Price Action/Trends and Pivots: The red diagonal line measures the length of the stock’s upward trend from its low point in January at around $48.50 to its peak in late May at around $75. It also informs the Fibonacci trend retracement lines shown on the right side of the chart. From that high, the stock has dropped back sharply, marking immediate resistance at around $61.50, where the 50% retracement can be seen, and current support expected at around $58.50, around the 61.8% retracement line. A push above $61.50 should give the stock room to rally to about $65, where the 38.2% retracement line sits, while a drop below $58.50 should find next support at around $56.50.
Near-term Keys: MU’s dividend, while conservative, is also relatively new; the company announced its first-ever dividend payout in the third quarter of 2021. Unfortunately, the dividend itself isn’t enough, since Net Income and Free Cash Flow are sharply negative, to make the stock look like an interesting opportunity at its current price. If you prefer to focus on short-term trading strategies, you could use a push above $61.50 to consider buying the stock or working with call options, using $65 as a practical bullish target. A drop below $58.50 could be a signal to consider shorting the stock or buying put options, with $56.50 offering a practical profit target on a bearish trade.