One of the tools that I have learned to use to keep a finger on the pulse of the market is to pay attention to sectors of the economy that complement others.
I find the Materials sector to be one of the more interesting sectors of the market, because it encompasses a pretty wide range of business types. It’s also an industry that the average consumer probably doesn’t think much about—I think primarily because as consumers we tend to be aware of just the finished goods and products that we use at any given time. Stocks in this sector, however, are usually the companies that provide the components that manufacturers use to create the products and goods we consume. That’s where the diversity of business types comes into play: the sector includes paper manufacturers and wood processors to chemical companies producing everything from plastics to fertilizers and more, and that makes them highly complementary to wide segment of the overall economy.
The shift over the past couple of years from pandemic-driven restrictions to normalized business and social activities have coincided with significant increases in inflation, which have naturally prompted increases in interest rates. While many analysts and economists have hoped that, after more than a year of rate increases, the Fed might begin to lower rates later this year, the Fed has indicated its preference to leave rates at elevated levels in order to evaluate the actual effect they have over time – a decision that is likely to keep the market on uncertain footing.
An interesting place to analyze economical impact is on the demand for agricultural products like corn. Corn is a crop that is used for everything from the dinner on your plate to the production of ethanol, a fuel additive designed to make fuel consumption cleaner and more environmentally friendly. High corn demand also over to the Materials sector, specifically as it relates to the need for nitrogen fertilizers. In 2020, favorable weather in the U.S. during the first quarter gave farmers an opportunity to start planting early, which then contributed to oversupply issues on this commodity that began with the collapse of demand at the beginning of the pandemic.
In 2022, and going into this year, additional pressure has come from the Russia-Ukraine war and its impact on global grain as well as natural gas supply. Those acted as a drag on companies in the Materials sector like CF Industries Holdings Inc (CF). This is a mid-cap producer of nitrogen and phosphate fertilizer. That makes them highly dependent on natural gas and ethanol, and subject to the variances in prices of those commodities. The stock has followed a long-term downward trend, from a peak in August of last year at around $120 to its low point at the beginning of June at around $60. This is a company with an interesting set of fundamental strengths, which include a very healthy balance sheet, along with healthy Free Cash Flow and operating margins. How does the stock’s current price activity, along with the company’s fundamentals, speak to its value proposition? Let’s find out.
Fundamental and Value Profile
CF Industries Holdings, Inc. is a manufacturer of hydrogen and nitrogen products for clean energy, fertilizer, emissions abatement, and other industrial applications. The Company operates nitrogen manufacturing complexes in the United States, Canada and the United Kingdom. Its segments include Ammonia, Granular Urea, UAN, AN and Other. The Ammonia segment produces anhydrous ammonia (ammonia), which contains 82% nitrogen and 18% hydrogen. The Granular Urea segment produces granular urea, which contains 46% nitrogen. The UAN segment produces urea ammonium nitrate solution (UAN). UAN is a liquid fertilizer product with a nitrogen content that typically ranges from 28% to 32%, and is produced by combining urea and ammonium nitrate. The AN segment produces ammonium nitrate (AN). AN, which has a nitrogen content between 29% and 35%, is produced by combining anhydrous ammonia and nitric acid. The Other segment includes diesel exhaust fluid (DEF), urea liquor, and nitric acid. CF has a current market cap of about $14 billion.
Earnings and Sales Growth: Over the last twelve months, earnings declined by -32.3%, while revenues were almost -30% lower. In the last quarter, earnings declined by nearly -34.5% while sales were -22.85% lower. The company’s margin profile is healthy, but has weakened over the last three months; Net Income as a percentage of Revenues in the last quarter is 27.83%, from 26.26% over the last twelve months.
Free Cash Flow: CF’s free cash flow is $2.9 billion, translates to a Free Cash Flow of 21.08%. This number has declined steadily over the past year, from about $4 billion a year ago, and $3.4 billion in the quarter prior. The decline support the idea that the company, like many companies in this sector, is dealing with rising input costs that have made up part of the inflation story that has defined the U.S. economy for the past year and a half.
Debt to Equity: CF’s debt to equity is .37, a conservative number that signals the company’s conservative approach to leverage. Their balance sheet shows cash and liquid assets were about $2.8 billion in the last quarter (an increase from about $2.4 billion a year ago), versus $2.96 billion in long-term debt. Their free cash flow, along with healthy operating margins as well as their healthy liquidity indicate that they have sufficient operating income to service their debt.
Dividend: CF’s annual divided is $1.60 per share, which translates to a yield of about 2.23% at the stock’s current price. It also noteworthy that the dividend increased from $1.20 per share at the start of 2022.
Price/Book Ratio: there are a lot of ways to measure how much a stock should be worth; but I like to work with a combination of Price/Book and Price/Cash Flow analysis. Together, these measurements provide a long-term, fair value target around $87 per share. That means that at the stock’s current price, it is undervalued, with about 21% upside from its current price.
Technical Profile
Here’s a look at the stock’s latest technical chart.
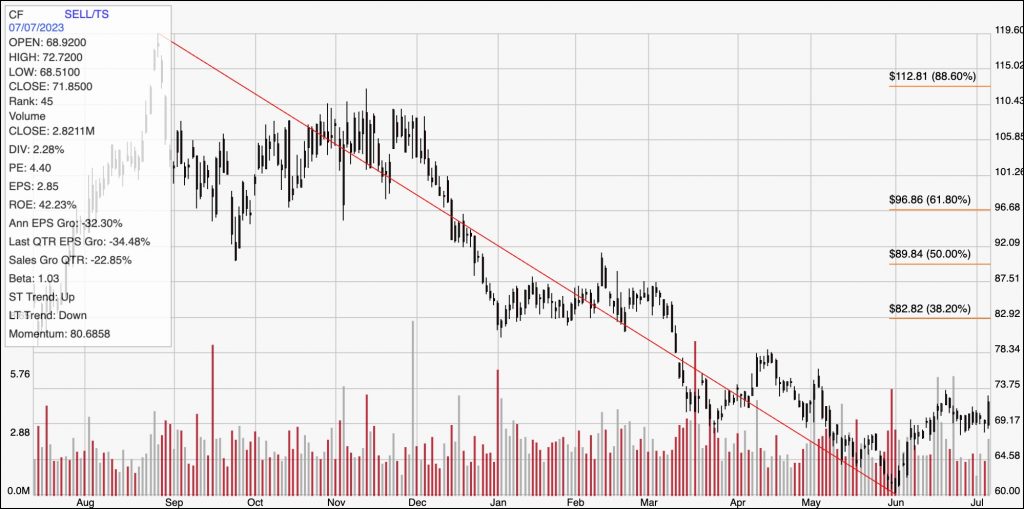
Current Price Action/Trends and Pivots: The diagonal red line traces the stock’s downward trend over the past year. It also provides the baseline for the Fibonacci retracement levels shown on the right side of the chart. From the bottom of its downward trend in June at around $60, the stock has rallied to its current price at around $72. The stock is nearing immediate resistance at around $74, with current support at around $69. A push above $74 should have near-term upside to about $78 per share, with additional room to about $83, around the 38.2% retracement line if buying activity increases. A drop below $69 should find next support at around $64.50, however the stock could easily test its 52-week low at around $60 if selling pressure accelerates.
Near-term Keys: CF’s fundamentals are very solid, with a balance sheet that is among the strongest in its industry, in spite of a declining pattern in Free Cash Flow and Net Income over the last year. It also offers an interesting value proposition at its current price, which should make it attractive for contrarian-minded bargain hunters. If you prefer to work with short-term, momentum-driven trading strategies, you could use a drop below $69 would be a strong signal to consider shorting the stock or buying put options, using $64.50 as a useful, initial and practical profit target on a bearish trade. A push above $74 could also act as a useful signal to think about buying the stock or working with call options, using $78 as a useful, initial profit target on a bullish trade, and $83 offering a secondary price target if buying activity intensifies.