It seems that every year, economic and market activity finds a way to revolve around one or two primary themes.
It’s safe to say that no matter where you start, the primary economic theme for most of the last year and a half, if not longer, boils down to inflation. Economic metrics were clearly starting show that inflation was picking up steam in late 2021, and last year only confirmed that fact even more, with indicators consistently showing levels from one month to the next that hadn’t been seen in four decades. 2023 has seen more of the same, along with the Fed’s natural reaction, which is to start raising interest rates, which is the first, and most obvious impact inflation has on the economy. As the primary tool central banks in market-driven economies have to influence economic growth, rising interest rates are the first lever that almost always gets pulled when the Fed decides it needs to slow down the pace of inflation. 2022 and 2023 have seen consistent increases in interest rates, with the Fed only recently beginning to suggest that the time may be near to leave rates where they are for a while to measure the real impact a tightened monetary policy has over time.
With consumer prices already high, and the impact of rising interest rates now a functional reality for consumers and businesses alike, the normal expectation is that consumer demand for discretionary goods and services should decline. Since the market tends to act in a forward-looking fashion – meaning that it prices in both fear and enthusiasm about what investors think is going to happen, before it actually does – the net result is economic uncertainty that extended throughout last year, and kept all of the major market indices at bear market levels. While 2023 has seen the major market indices stage their own upward trend reversals from those 2022 lows, the sustainability of those reversals remains in question as economic indicators come in more and more mixed, and more and more companies in just about every sector of the economy are beginning to see the impact of inflation and high interest rates on their balance sheets and operating metrics.
Economic uncertainty may blunt some of the enthusiasm for industries tied to stocks in industries that are considered “discretionary,” or sensitive to the ebb and flow of economic growth. For contrarians like me, the irony of that gloomy forecast is twofold. First, it comes in contrast to economic data that continues to show generally healthy consumer spending, even as prices have increased, along with continued, healthy employment numbers. Second, economic uncertainty doesn’t eliminate the opportunity to find stocks in those pockets of the market that could mark the best bargains, since declining stock prices may not directly correlate with a company’s fundamental strength. It’s true that they’re harder to find the longer uncertainty continues, but it’s also why, even as others may look to avoid economically sensitive sectors and industries, smart bargain hunters start looking for new “targets of opportunity”.
That brings me to today’s highlight. Levi Strauss & Co. (LEVI) is a name most of us in North America – and even a big part of the world – are familiar with, and a brand that I think speaks as much to Americana as country music, Mickey Mouse and apple pie. This is a stock that has been following a strong downward trend for the past year, falling from a 52-week high at around $20.50 in August of last year to its low at around $13, reached in late May. The stock staged a temporary rally to about $15 last month, but the stock has been fading back from that point, with the stock now sitting a little above $13 per share. With a fundamental profile that points to healthy liquidity, and manageable debt, the question is whether the company’s operating metrics lend additional weight to the idea that the stock’s downward trend might translate to a useful buying opportunity. Let’s dive in.
Fundamental and Value Profile
Levi Strauss & Co. is an apparel company. The Company designs, markets and sells directly or through third parties and licensees products that include jeans, casual and dress pants, tops, shorts, skirts, jackets, footwear and related accessories for men, women and children under the Levi’s, Dockers, Signature by Levi Strauss & Co. and Denizen brands. The Company operates through three segments: the Americas, Europe, and Asia. Its Asia segment includes the Middle East and Africa. The Company’s products are sold in approximately 50,000 retail locations in more than 110 countries, including approximately 3,000 brand-dedicated stores and shop-in-shops. It has approximately 1,039 Company-operated stores located in 36 countries and approximately 500 Company-operated shop-in-shops. The remainder of its brand-dedicated stores and shop-in-shops are operated by franchisees and other partners. LEVI’s market cap is around $5.3 billion.
Earnings and Sales Growth: Over the last twelve months, earnings declined by -86.2%, while revenues also declined by -9.13%. In the last quarter, earnings declined by about -88.25% while sales declined by nearly -21%. LEVI’s operating profile is showing signs of weakness; over the last twelve months, Net Income was 7.12% of Revenues and declined to -0.12% in the last quarter.
Free Cash Flow: LEVI’s free cash flow has been negative for the past three quarters, with this metric coming in at -$125.57 million over the last twelve months. That marks a decline from $193.44 million a year ago, and from $578.25 million in 2021. This pattern confirms the picture described by the negative Net Income numbers described above.
Debt to Equity: LEVI’s debt/equity ratio 0.52. This is a low number that speaks to management’s conservative approach to leverage. As of the last quarter, the company reported about $471.6 million in cash and liquid assets against about $1 billion in long-term debt. The current negative pattern from Free Cash Flow and Net Income makes it clear that the company’s cash position is being eroded by rising costs in the current inflationary environment. If this pattern isn’t reversed in the quarters ahead, the company’s ability to continue servicing its debt, or to sustain its dividend could come into question.
Dividend: LEVI’s annual divided is $.48 per share, which translates to a yield of 3.66% at the stock’s current price.
Price/Book Ratio: there are a lot of ways to measure how much a stock should be worth; but I like to worth with a combination of Price/Book and Price/Cash Flow analysis. Together, these measurements provide a long-term target at about $14 per share. That suggests that the stock is only slightly undervalued, with about 5% upside from its current price, and a useful bargain price at around $11 per share.
Technical Profile
Here’s a look at the stock’s latest technical chart.
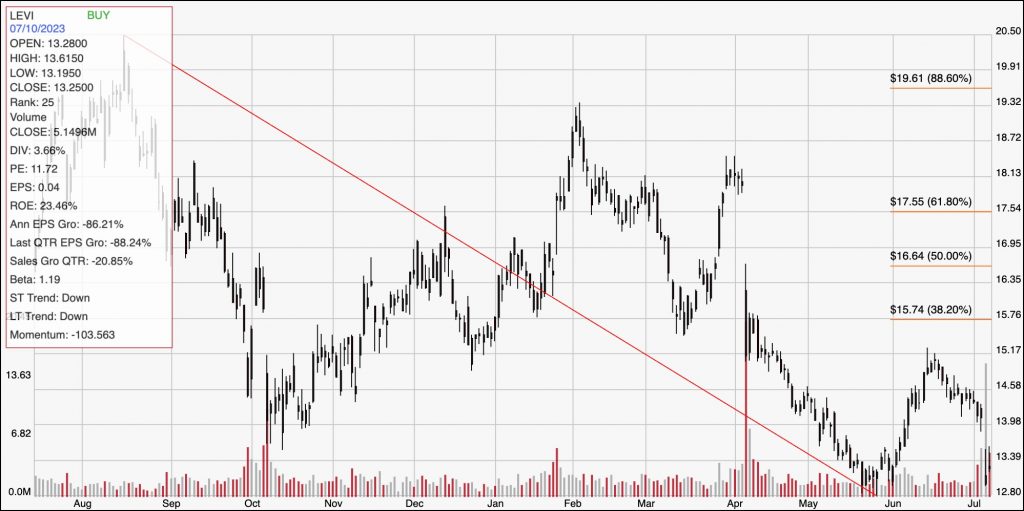
Current Price Action/Trends and Pivots: The red diagonal line traces the stock’s downward trend from a peak at around $21 in August of last year to its recent low in late May at around $13. It also provides the baseline for the Fibonacci retracement lines shown on the right side of the chart. The stock is currently testing current support at its $13, 52-week low, with immediate resistance not far away at around $14 – where the stock sat prior to latest earnings report, and from which the stock fell overnight to its current price area. A push above $14 has limited upside, to the last pivot high at $15, and then to about $16 where the 38.2% retracement line sits if buying activity picks up. A drop below $13 should find next support at around $12.
Near-term Keys: LEVI’s balance sheet remains generally strong, despite the fact that its operating costs are clearly outpacing revenues right now. Declining liquidity and Net Income have been a concern since late last year, which I take as a clear reflection of rising material and other input costs, and support the idea the stock doesn’t offer a useful value proposition at its current price. Short-term, directional trading strategies are also risky right now, with limited profit potential on either bearish or bullish trade. However, if you’re willing to work with very quick exits, you could take a push above $14 as a signal to buy the stock or work with call options, with $15 providing a practical exit target. A drop below $13 could be a signal to consider shorting the stock or buying put options, so long as you’re ready to take profits at around $12 per share on a bearish trade.