More than two decades of experience as a student of the markets have taught me that while the market is generally resilient, there is one word that always seems to automatically put the market on edge: change.
For the last few years, change has been a constant reality in the global economy. Whether you want to talk about the coronavirus, inflation and rising interest rates or war in Ukraine and its multi-faceted impact on the world, change is a recurring theme that has kept the markets on edge for most of the past year and a half.
The reality of inflation is that it is an ever-present dynamic with which any and all economies have to contend. The real concern for any market-based economy is inescapably tied to the ebb and flow of inflationary pressures. Lack of inflation implies that costs are being driven down, which sounds good at first blush, but in an extended, extreme state, it points to declines in demand that usually signal bigger problems at the extremes. Flip the coin, and increasing inflation does suggest that costs are increasing, but is generally a positive when it is attributed to the rising demand from businesses and consumers that we all generally take as indicative of a healthy, growing economy. The concern is that when inflation has been extended to extreme highs, there are larger issues that prevent suppliers from effectively meeting demand.
One of the areas that has been seeing a strong reaction to these indications of cost inflation is in the Food Products industry – an industry that I usually like to think of as a good way to position a portfolio with conservative, even defensive options to help moderate risk. One specific area that has been showing inflationary conditions is in the cost of goods companies in this industry have been seeing for most of the last two years or so. Conagra Brands, Inc. (CAG) is an example. Management has cited cost increases to explain pressures on its business that have hampered liquidity and increased long-term debt, and which they also used at the beginning of 2022 to taper their own estimates for the company’s financial performance. Despite that grim forecast, the stock followed an upward trend for most of 2022 that peaked at the start of 2023 at around $41. From that peak, the stock has dropped into a clear downward trend, with the latest low coming this week at around $32. What is the story that the company’s fundamentals tell now? Are they strong enough to suggest the drop could offer a useful opportunity for value seekers? Let’s dive in and find out.
Fundamental and Value Profile
Conagra Brands, Inc., formerly ConAgra Foods, Inc., operates as a packaged food company. The Company operates through two segments: Consumer Foods and Commercial Foods. The Company sells branded and customized food products, as well as commercially branded foods. It also supplies vegetable, spice and grain products to a range of restaurants, foodservice operators and commercial customers. Conagra Foodservice offers products to restaurants, retailers, commercial customers and other foodservice suppliers. The Company also operates in the countries outside the United States, such as Canada and Mexico. The Company’s brands include Marie Callender’s, Healthy Choice, Slim Jim, Hebrew National, Orville Redenbacher’s, Peter Pan, Reddi-wip, PAM, Snack Pack, Banquet, Chef Boyardee, Egg Beaters, Rosarita, Fleischmann’s and Hunt’s. The Company sells its products in grocery, convenience, mass merchandise and club stores. CAG’s current market cap is $15.4 billion.
Earnings and Sales Growth: Over the last twelve months, earnings declined by -4.6%, while Revenues improved by 2.16%. Earnings decreased in the last quarter by -18.42%, while sales slipped -3.67% lower. The company’s margin profile over the last twelve months is showing signs weakness. Net Income was 2.84% of Revenues over the past twelve months and increased to 2.84% in the last quarter.
Free Cash Flow: CAG’s free cash flow is $636.4 million over the last twelve months. That marks a decline from $886.6 million a year ago, and below the $765.8 million mark from the last quarter. The current number also translates to a modest Free Cash Flow Yield of about 4.13%.
Debt to Equity: CAG has a debt/equity ratio of .80. That number has declined from 1.58 at the beginning of 2019, but the actual long-term debt number remains high, a reflection of the reality that the company’s liquidity has been a significant, long-term question mark. In the last quarter Cash and liquid assets were about $93,9 million – an improvement from $67.4 million a year ago, but still well below its $438.2 million mark in the last quarter of 2020. The company also reported about $7.1 billion in long-term debt. Most of that debt is attributable to CAG’s acquisition of Pinnacle Foods in the last quarter of 2018, and it is true that the company has paid down more than $4.8 billion of that debt over the course of the last two years, which can at least partly explain the steady decline in cash and liquid assets.
Dividend: CAG pays an annual dividend of $1.40 per share – which the company increased from $.85 in its last earnings call of 2020, $1.10 in 2021, $1.25 in mid-2022, and $1.32 prior to the latest earnings announcement. It also translates to an annual yield of about 4.34% at the stock’s current price. An increasing dividend is a strong sign of management’s confidence in their business model and their operating success in the future.
Price/Book Ratio: there are a lot of ways to measure how much a stock should be worth; but I like to work with a combination of Price/Book and Price/Cash Flow analysis. Together, these measurements provide a long-term, fair value target at about $26 per share. That means the stock is very overvalued at its current price, with -18.5% downside and a practical discount price at around $21. It is also worth noting that at the end of 2021, this same analysis put the stock’s fair value target at around $34.50 per share, $45 during the first half of that year, $31 in 2022, and $36 at the beginning of this year.
Technical Profile
Here’s a look at the stock’s latest technical chart.
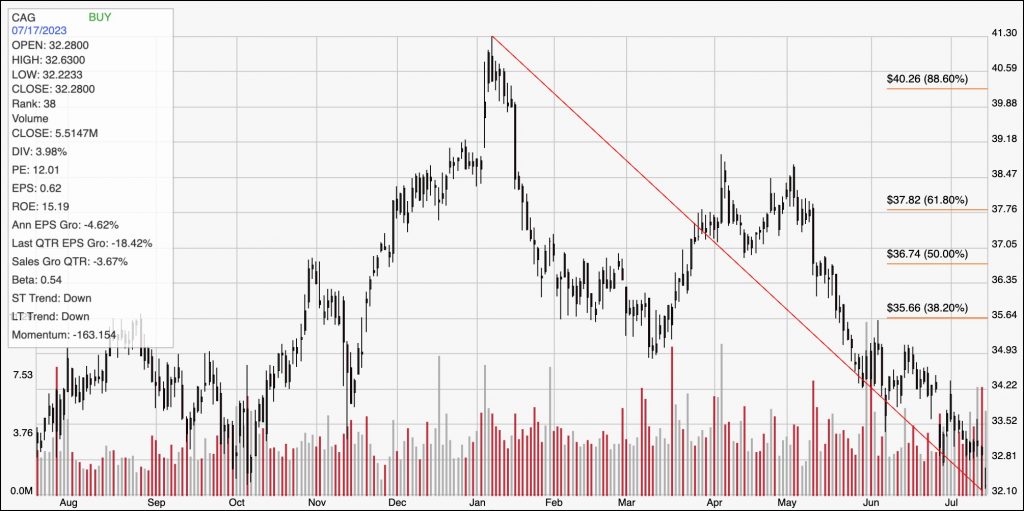
Current Price Action/Trends and Pivots: The chart above marks the stock’s price activity over the last year. The red diagonal line marks the stock’s downward trend from its 52-week high at around $41 to its recent low at around $32. It also provides the baseline for the Fibonacci retracement lines shown on the right side of the chart. The stock’s downward trend is clear, and appears to be picking up bearish momentum, with the stock sitting right around $32 as of this writing, which I’m marking as current support for the time being. Immediate resistance is around $33, where the stock held support earlier this month. A drop below $32 should see limited downside, with next support at around $31 based on the current distance between support and resistance, while a push above $33 could see near-term upside to between $34 and $35 based on pivots seen in late May and June.
Near-term Keys: From a fundamental standpoint, CAG’s profile has lost quite a bit of its luster, with the last few earnings reports doing little to improve the picture. Declining Net Income, along with declining Free Cash Flow and limited liquidity remain big red flags. There is also no practical way right now to suggest the stock offers a useful value to make it an attractive long-term, defensive buying candidate. That means that the best probabilities if you want to work with CAG lie in short-term, momentum-based trading strategies – specifically, on the bullish side, since there is limited, useful downside for a bearish trade. You could use a push above $33 as a signal to consider buying the stock or working with call options, with an eye on $35 as a reasonable profit target on a bullish trade.