A big piece of successful value investing involves the ability to identify useful “targets of opportunity.”
That’s something that isn’t altogether easy, but it can be done in a few different ways. One approach is to work from top to bottom. Rather than sifting through thousands of individual stocks, that means starting at the broad market level and drilling down into sectors and industries, and then into stocks within those industries.
Value investing by nature also requires a bit of a contrarian personality, since a lot of the focus turns to stocks and industries sitting at or near historical lows. If you’re thinking about using a top-down approach, that should make sense, because if an entire industry is sitting at historical lows, you’re probably going to see most stocks in the industry doing the same. Stocks and industries at historical lows scare growth-oriented investors away, but for value investors, they represent some of the highest-probability opportunities to buy a good company at an attractive price.
The thing that I like about seeing an entire industry at historical lows is that it becomes easier to find stocks in the industry that have solid fundamental strength in spite of the recent decline in their stock price. That’s where the “target of opportunity” gets easier to recognize, and it’s why I’ve found using this “top down” approach to be useful.
Here’s one of the latest examples of applying a “top down” approach. Earlier this year, one of the worst industries in the market to watch was the Banking industry. The very publicized failures of large venture capital banks Silicon Valley Bank and Signature Bank, followed by the collapse of Swiss giant Credit Suisse, brought the entire industry crashing down. From the start of February to mid-March, the industry fell about -26.6%, as measured by the S&P Banking SPDR ETF (KBE). That prompted a lot of people, from average investors to talking heads and government officials to start worrying that those failures would infect the entire industry, prompted the kind of financial crisis that proved to be the last, fatal leg in 2008 that pushed the entire economy into its last, extended recession.
Since then, a lot of information has come from company earnings reports showing that most of the worst problems that took down those three banks are relatively confined. Many of the largest banks in the U.S. are well-shielded from those extreme risks, and many regional banks in particular are proving in their latest financial reports to be on solid footing as well. For a bargain hunter like me, that means that this is an industry that has been worth paying attention to for most of the last three months.
That brings me to today’s highlight. Wells Fargo & Co. (WFC) is one of the largest national banks in the U.S., and one that took the brunt of the banking sell off, falling from a yearly high at around $49 to a low at around $35 in mid-March. The stock has rebounded strongly since then as analysts have pointed to the company’s fundamental strengths, including healthy Free Cash Flow, a fortress-level balance sheet, and improving profitability. Even with the stock’s latest push higher, the stock carries an interesting value proposition. Does that mean you should be considering WFC as a useful long-term opportunity? Let’s dive in to the numbers.
Fundamental and Value Profile
Wells Fargo & Company is a financial services company. The Company provides a diversified set of banking, investment and mortgage products and services, as well as consumer and commercial finance, through banking locations and offices, the Internet (www.wellsfargo.com) and other distribution channels to individuals, businesses and institutions in states, the District of Columbia and in countries outside the United States. The Company provides consumer financial products and services, including checking and savings accounts, credit and debit cards, and auto, mortgage and home equity, and small business lending. In addition, the Company offers financial planning, private banking, investment management, and fiduciary services. The Company also provides financial solutions to businesses through products and services including traditional commercial loans and lines of credit, letters of credit, asset-based lending, trade financing, treasury management, and investment banking services. WFC has a current market cap of $170.3 billion.
Earnings and Sales Growth: Over the last twelve months, earnings increased by nearly 69%, while sales grew about 53.4%. In the last quarter, earnings grew almost 1.63% while revenues where about 5.42% higher. Their operating profile is also very healthy, and growing; Net Income as a percentage of Revenues was 16.06% over the last year, and increased to 17.51% in the last quarter.
Free Cash Flow: Free Cash Flow is healthy, at a little more than $34 billion over the past twelve months. This number has also increased steadily over the past year, from $24.6 billion. The current number translates to an attractive free cash flow yield of 19.27%.
Debt to Equity: the company’s debt to equity ratio is 1.05, which sounds high, but isn’t atypical for the Banking industry. It also doesn’t tell the real story about WFC’s balance sheet. Their balance sheet indicates operating earnings are more than sufficient to service their debt, with $318.7 billion in cash and liquid assets and $170.6 billion in long-term debt.
Dividend: WFC pays an annual dividend of $1.20 per share, which translates to an annual yield of 2.55% at the stock’s current price.
Price/Book Ratio: there are a lot of ways to measure how much a stock should be worth; but I like to work with a combination of Price/Book and Price/Cash Flow analysis. Together, these measurements provide a long-term, fair value target at around $61.50 per share. That means that WFC is is undervalued, with a little more than 30% upside from its current price right now.
Technical Profile
Here’s a look at the stock’s latest technical chart.
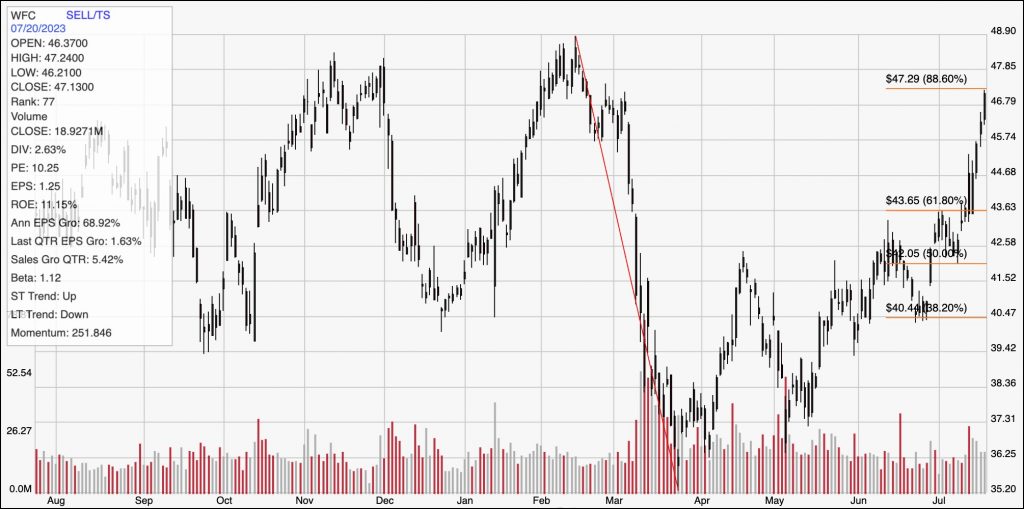
Current Price Action: The chart above displays the stock’s price action over the past year. The red diagonal line displays the stock’s downward turn from a $49 peak in February to its 52-week low, reached in the middle of March at around $35 per share. It also provides the baseline for the Fibonacci retracement lines shown on the right side of the chart. From that low, the stock has rallied strongly, picking up a lot of new momentum after the latest earnings report, and pushing the stock above all of its major retracement lines and just a couple of dollars away from its yearly high. Immediate resistance is at around $47, where the 88.6% retracement line sits, with current support expected at around $46 based on pivot activity in that price area at multiple points in the last six months or so. A push above $47 should retest the stock’s 52-week high at $49, with room to push to about $51 if first resistance doesn’t hold. A drop below $46 could see the stock drop to about $43.50 to next support, based on the 61.8% retracement line.
Near-term Keys: WFC boasts a number of useful fundamental strengths, with an interesting value proposition sitting as the cherry on top right now despite the stock’s impressive rally since March. That doesn’t mean there aren’t risks to be considered – banks in general are highly sensitive to changes in interest rates, and a recession would imply slowdowns in the company’s lending business. If you’re willing to take on those risks, the stock could work as an interesting value opportunity at its current price. If you prefer to work with short-term trading strategies, a push above $47 could be a good signal to consider buying the stock or working with call options, with $49 providing a useful profit target. A drop below $46 could be an interesting signal to consider shorting the stock or buying put options, with next support at around $43.50 providing a practical profit target on a bearish trade.