No matter what the market’s current direction may be, the hunt for useful opportunities never really ends for a bargain hunter.
One of the pockets of the market that I always find interesting is the Energy sector. Energy products in the form of crude oil, natural gas, heating oil, and others make up some of the basic building blocks for a lot of the finished goods that drive economic activity, which means that energy demand is about a lot more than just filling up your automobile or heating your house in the winter. Healthy demand has kept oil prices well above their 2021 levels, and that’s been a positive things for a lot of Energy-related stocks. While the war in Ukraine continues to be a disruptive factor on both the geopolitical, economic front, and tragic on a humanitarian level, it has also kept oil and natural gas demand high for producers in other parts of the world, from the Middle East to North America. That can help explain, at least in part why a lot of Energy stocks have not only weathered the storm of the last year and a half better than other sectors, but in some cases have also been among the market’s star performers. All across the energy supply chain, from explorers and drillers to transportation and storage, as well as the companies that provides equipment and services, higher energy prices have provided a tailwind that has helped blunt the opposing headwind of rising input costs.
Schlumberger N.V. (SLB) is one of the largest companies in the world in the Energy Equipment & Services industry. After falling to a July 2022 low at around $30.50, the stock staged an impressive upward trend that saw its peak in January at about $63. From that point, the stock dropped back into a downward trend that bottomed in May at around $43. The stock has staged a strong rally from that point, pushing to around $58 per share as of this writing. What’s driving the surge? Are the company’s fundamentals, contrasted against that drop in price, strong enough to justify the move, and possibly to even provide an opportunity for long-term bargain hunters? Let’s take a look.
Fundamental and Value Profile
Schlumberger N.V. provides technology for reservoir characterization, drilling, production and processing to the oil and gas industry. The Company’s segments include Reservoir Characterization Group, Drilling Group, Production Group and Cameron Group. The Reservoir Characterization Group consists of the principal technologies involved in finding and defining hydrocarbon resources. The Drilling Group consists of the principal technologies involved in the drilling and positioning of oil and gas wells. The Production Group consists of the principal technologies involved in the lifetime production of oil and gas reservoirs and includes Well Services, Completions, Artificial Lift, Integrated Production Services (IPS) and Schlumberger Production Management (SPM). The Cameron Group consists of the principal technologies involved in pressure and flow control for drilling and intervention rigs, oil and gas wells and production facilities. SLB has a current market cap of $82.1 billion.
Earnings and Sales Growth: Over the last twelve months, earnings increased 44%, while sales were almost 19.6% higher. In the last quarter, earnings rose by 14.3% while sales were 4.7% lower. SLB’s operating profile is healthy, and steady; Net Income versus Revenue over the last year was 12.63%, and rose slightly in the last quarter to 12.75%.
Free Cash Flow: SLB’s Free Cash Flow is generally healthy, at almost $3.2 billion over the last twelve months. That represents a small increase from $2.6 billion a year ago, and $2.3 billion in the prior quarter. The current number translates to a very modest Free Cash Flow Yield of 3.89%.
Debt to Equity: SLB has a debt/equity ratio of .6, a conservative number that signals a conservative approach to leverage. Cash and liquid assets in the last quarter were about $3.2 billion versus about $11.3 billion in long-term debt. The company’s operating profile, and healthy Free Cash Flow suggest the company should have no problem servicing its debt.
Dividend: SLB pays an annual dividend of $1.00 per share, which at its current price translates to a dividend yield of about 1.73%.
Price/Book Ratio: there are a lot of ways to measure how much a stock should be worth; but I like to worth with a combination of Price/Book and Price/Cash Flow analysis. Together, these measurements provide a long-term target at about $29.50 per share. That means the stock is overvalued, with more than -48% downside from the stock’s current price, and a useful discount at around $23.75. It is also worth noting that in the last quarter, this same analysis yielded a fair value target at around $22.
Technical Profile
Here’s a look at the stock’s latest technical chart.
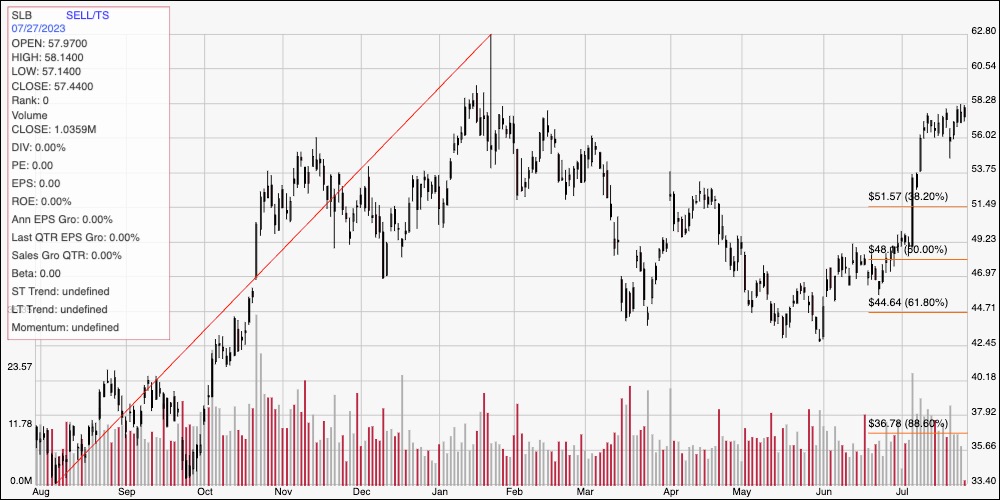
Current Price Action/Trends and Pivots: The chart above displays the last year of price activity, with the diagonal red line tracing the stock’s rally from about $33.50 in August 2022 to a peak at around $63 in January. It also provides the baseline for the Fibonacci retracement lines shown on the right side of the chart. From a low at around $43 at the end of May, the stock has rallied strongly, pushing above all three major retracement lines and sitting very near immediate resistance at around $59 from a pivot high point in mid-January. Current support is around $56, with the stock showing resilience throughout this month around that level. A push above $59 should have momentum to test the stock’s yearly peak at around $63, which a drop below $56 could see downside to about $52, based on pivot lows seen in February along with a pivot high in April around that level.
Near-term Keys: There really isn’t any way to suggest that SLB’s value proposition right now is useful, even with the company’s generally healthy fundamental profile. That means that the best probabilities to work with this stock lie with short-term trading strategies; if the stock drops below $56, consider shorting the stock or buying put options, using $52 as a practical, bearish profit target. A push above $59 could offer an interesting signal to buy the stock or work with call options, using $63 as a a useful profit target on a bullish trade.