Mr. Cooper Group Inc. (COOP) engages in non-banking services for mortgage loans the United States. The company operates through two segments: Servicing and Originations.
The Servicing segment performs activities for underlying mortgages, including collecting and disbursing borrower payments, investor reporting, customer service, and modifying loans.
The Originations segment originates residential mortgage loans through its direct-to-consumer channel, as well as originates and purchases loans from mortgage bankers. It operates primarily under the Mr. Cooper and Xome brands.
The analysis provides an in-depth look at Mr. Cooper Group Inc (COOP), covering its stock performance, financial metrics, and trading characteristics:
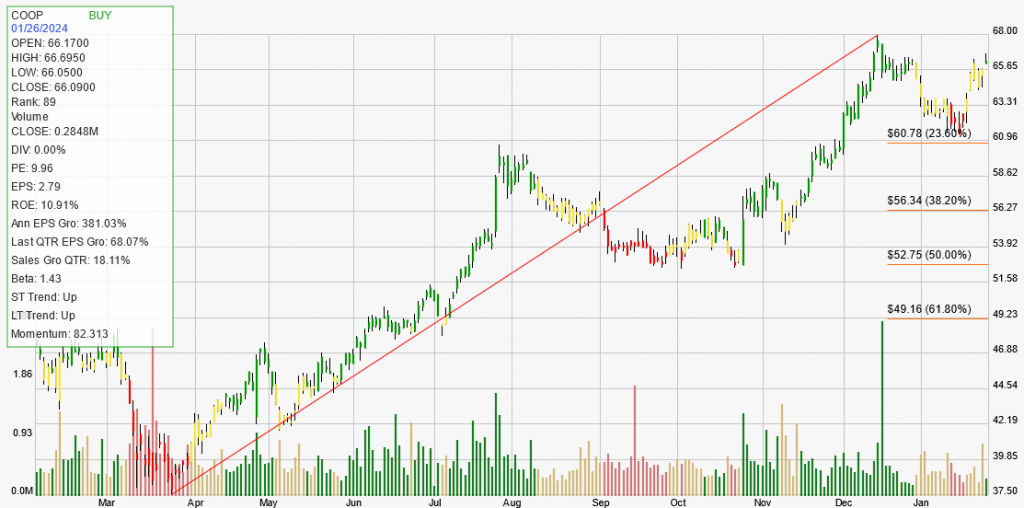
Stock Information: COOP is currently priced at $66.09, showing a modest daily increase of 0.52%.
Sector and Industry: It belongs to the Finance sector and operates within the Finance – Consumer Loans industry.
Trends
Long-Term Trend: There’s an upward trend, indicating positive performance over the past 180 trading days.
Short-Term Trend: The trend is also upward in the short term, observed over the past 7-10 days.
Signal: The current signal is a ‘BUY’, suggesting potential advancement in the stock’s trend. The current price trend is not considered extreme.
Strength Rank: COOP’s rank is 89, meaning it is outperforming 89% of its peers. This ranking, especially above 80, typically indicates a likelihood of continued trend advancement.
Financial Metrics:
ROE (Return on Equity): 10.91%, indicating average financial efficiency.
Annual EPS Growth: A significant growth of 381.03%, far exceeding the typical 30% average for strong trending companies.
Quarterly EPS Growth: At 68.07%, it exceeds the 25% average, indicative of strong market leaders.
Quarterly Sales Growth: At 18.11%, it’s below the 25% average for strong trending stocks.
Dividend Yield: Currently at 0.00%.
Historical Trading Characteristics:
Trade Stats: Over the past year, COOP showed a total net gain of 19.27% from its trades.
Trade Expectancy: The annual trade expectancy is notably positive at 21.46%.
Average Duration: Trades typically last 63 days, with an average of 26 days between trades.
Backtesting Analysis: This indicates that the average gain on profitable trades was 17.68%, while the average loss on losing trades was 6.95%. The positive trade expectancy suggests profitability over time.
Conclusion: COOP’s strong annual EPS growth and solid ranking suggest potential for continued upward trend, despite its below-average quarterly sales growth. The stock’s historical trading characteristics and backtesting results indicate a generally positive performance, although past performance is not a definitive indicator of future results.