Dave Inc (DAVE) is a financial technology company that offers a range of financial services and products aimed at improving the financial health of its customers. The company is known for its mobile app, which provides features such as budgeting tools, automatic overdraft protection, and access to small cash advances to help users avoid overdraft fees from traditional banks. Dave’s mission is to help its users manage their finances better by providing tools and services that promote financial stability and empowerment. https://dave.com/
Enhanced Financial Management Tools: Dave is continuing to develop and improve its financial management tools, such as budgeting and forecasting features, to help users better manage their money. This could include more personalized financial advice and insights based on users’ spending habits and financial goals.
Expansion of Banking Services: Dave has been known for its cash advance service and overdraft protection. The company may be working on expanding its range of banking services to include features like savings accounts, investment options, or other financial products that can help users grow their wealth and achieve financial security.
Improving User Experience and Accessibility: With the increasing importance of user experience in the fintech industry, Dave is likely focusing on making its app and services more user-friendly and accessible. This could involve incorporating more advanced technologies like artificial intelligence and machine learning to provide a more seamless and intuitive user experience.
The summary for Dave Inc (DAVE) is as follows:
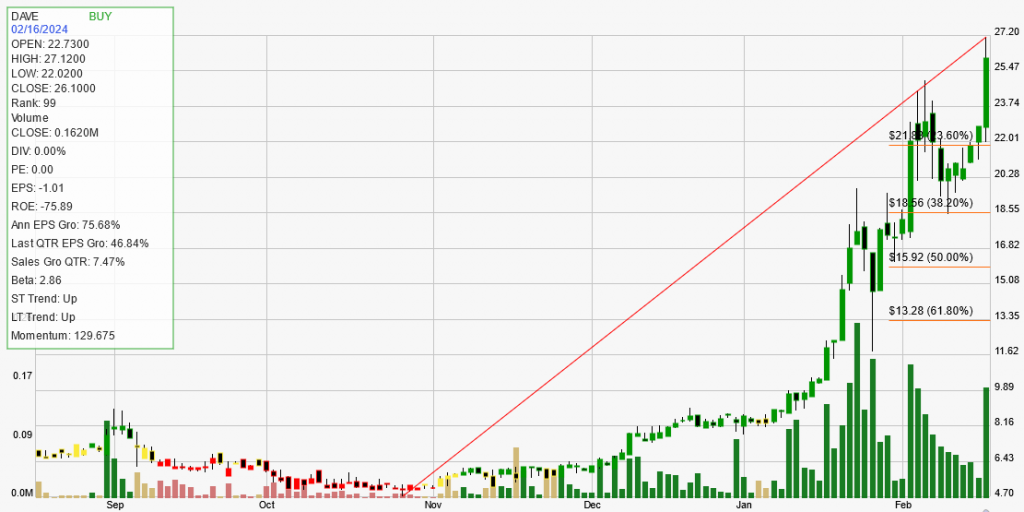
Stock Performance: The stock has shown a significant upward trend with a 14.73% increase in a day, 26.27% in a week, 112.2% in a month, 202.08% yearly, and 211.27% year-to-date.
Strength Rank: Dave Inc has a strength rank of 99, indicating it is outperforming 99% of its peers.
Financial Ratios: The company has a negative return on equity (ROE) of -75.89%, indicating low financial efficiency. The price-to-earnings (PE) ratio is 0.00, and the earnings per share (EPS) is -1.01.
Earnings Growth: The annual EPS growth is 75.68%, and the last quarter’s EPS growth is 46.84%. However, the quarterly sales growth is only 7.47%, which is below the desirable 25% for strong trending stocks.
Dividend Yield: Dave Inc does not pay a dividend, with a dividend yield of 0.00%.
Trading Statistics: The stock has had 3 trades with a total profit of $31,102.05 and a total loss of $1,236.56, resulting in a net profit/loss of $29,865.49. The average profit on winners is $15,551.02, and the average loss on losers is $1,236.56. The reward to risk ratio is 13.96, and the winning percentage is 66.67%.
Trade Expectancy: The trade expectancy is $11,094.69, with an annual trade expectancy of $33,284.06. The average days in a trade is 43, and the average days between trades is 15.
Overall, Dave Inc is showing strong upward momentum and outperforming most of its peers. However, its low quarterly sales growth and negative ROE indicate some areas of concern. Investors should consider these factors along with the company’s strong EPS growth and trading statistics before making investment decisions.