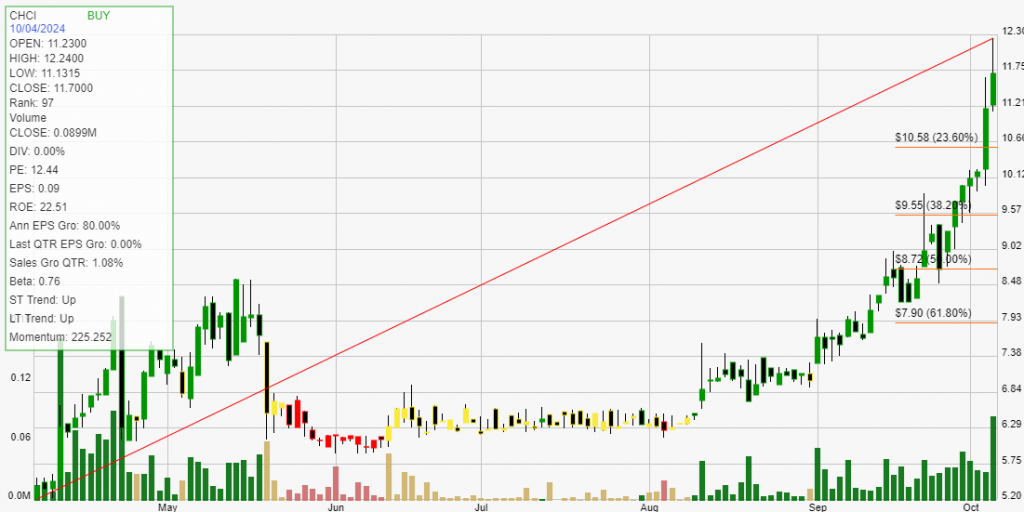
Comstock Holding Companies, Inc. is a real estate development and asset management company based in the Washington, D.C. metropolitan area. The company specializes in the acquisition, development, and management of mixed-use, residential, commercial, and retail properties.

Through its subsidiaries, Comstock focuses on creating vibrant, walkable communities that blend luxury living, office spaces, and retail environments, often near public transportation and other key infrastructure. The company also provides property management services and is involved in real estate investment and development, offering comprehensive solutions across the real estate lifecycle.
Comstock’s key projects include urban development projects, luxury residential communities, and transit-oriented developments. By combining these elements into well-planned spaces, Comstock meets the growing demand for live-work-play environments in highly desirable areas. Their properties often cater to a diverse range of clients, from homeowners and renters to businesses seeking modern commercial spaces. Additionally, the company’s asset management division provides property management and advisory services for real estate investors and property owners.
The main drivers of growth for Comstock Holding Companies include the rising demand for high-quality residential and commercial properties in urban centers, particularly in transit-oriented locations. As cities continue to expand and public transit becomes more essential, Comstock’s focus on these projects positions them well for sustained growth. Furthermore, the increasing demand for mixed-use developments that offer both residential and commercial spaces in one location allows the company to capitalize on long-term real estate trends. Learn more at Comstock Holding Companies, Inc..
Click The Image For Current Live Chart
Backtesting a stock can provide investors with critical statistical data. These results give you an informed perspective on how a stock trades within your chosen buying and selling method of analysis. The definition of trade expectancy is defined as: trade expectancy = (probability of win * average win) – (probability of loss * average loss). If the calculation returns a positive number, a trader should make money over time.
The average percentage gained on positive, money making trades was 25.34%. While the average percent loss on money losing trades was 3.37%.
Trade expectancy includes both winners and losers. Trade expectancy is displayed as a percentage. This backtest displays the dollar value, percentage, annual trade expectancy, and annual percent. Annual expectancy is the trade expectancy percentage multiplied by the number of trades per year.
The Trade expectancy % for CHCI over the past year is 10.99%. The number of trades generated per year was 5 giving an Annual Trade Expectancy of 54.93%
The average days in a trade is 31 and the average days between trades is 24.
With any method of analysis that uses past performance, it can be said that past performance is not indication of future performance. What is does provide is a probabilistic look at a stock’s price activity characteristics over time.