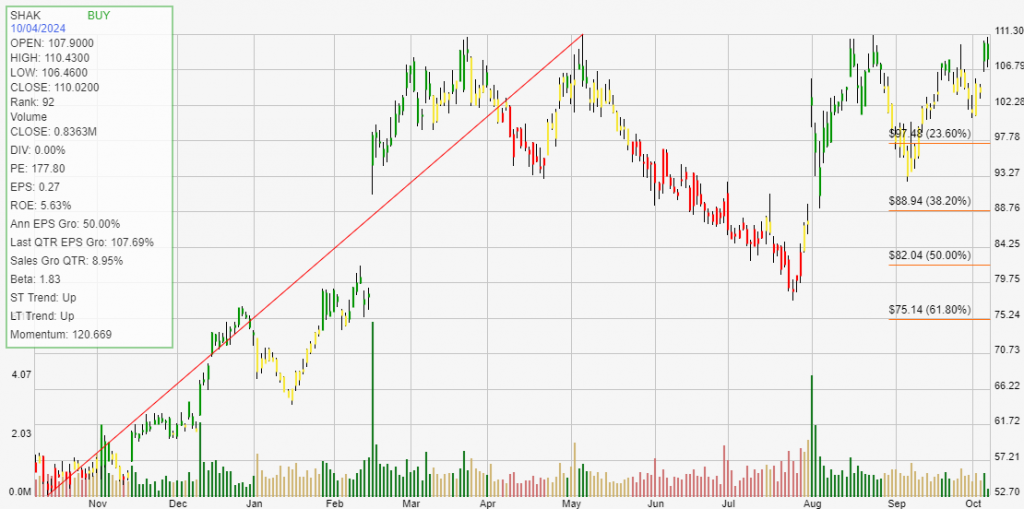
Shake Shack Inc. is a fast-casual restaurant chain known for its delicious burgers, hot dogs, crinkle-cut fries, and hand-spun milkshakes.

Founded in 2004 in New York City, Shake Shack has quickly grown into a popular dining destination, appealing to a wide range of customers seeking high-quality, made-to-order food in a casual setting. The company’s commitment to using fresh, all-natural ingredients, including hormone-free beef and cage-free chicken, sets it apart in the competitive fast-food landscape.
Shake Shack’s menu features signature items like the ShackBurger, Shack Stack, and Shack-cago Dog, alongside seasonal offerings and vegetarian options. In addition to its food menu, the restaurant chain is known for its extensive beverage selection, including local craft beers and wines at select locations. The company focuses on creating a welcoming atmosphere, often featuring modern design elements and outdoor seating to enhance the dining experience.
The main drivers of growth for Shake Shack include the increasing consumer demand for high-quality fast-casual dining experiences, particularly among younger demographics. As more customers seek healthier and ethically sourced food options, Shake Shack’s commitment to quality ingredients resonates well with its target audience. The company’s expansion strategy, including new location openings and international growth, further contributes to its revenue growth. Additionally, the rise of online ordering and delivery services has allowed Shake Shack to reach a broader customer base and adapt to changing dining preferences. Learn more at Shake Shack Inc..
Click The Image For Current Live Chart
Backtesting a stock can provide investors with critical statistical data. These results give you an informed perspective on how a stock trades within your chosen buying and selling method of analysis. The definition of trade expectancy is defined as: trade expectancy = (probability of win * average win) – (probability of loss * average loss). If the calculation returns a positive number, a trader should make money over time.
The average percentage gained on positive, money making trades was 39.86%. While the average percent loss on money losing trades was 5.28%.
Trade expectancy includes both winners and losers. Trade expectancy is displayed as a percentage. This backtest displays the dollar value, percentage, annual trade expectancy, and annual percent. Annual expectancy is the trade expectancy percentage multiplied by the number of trades per year.
The Trade expectancy % for SHAK over the past year is 17.29%. The number of trades generated per year was 4 giving an Annual Trade Expectancy of 69.16%
The average days in a trade is 59 and the average days between trades is 13.
With any method of analysis that uses past performance, it can be said that past performance is not indication of future performance. What is does provide is a probabilistic look at a stock’s price activity characteristics over time.