Life Time Group Holdings, Inc. (LTH) is a premier lifestyle brand that specializes in health and wellness through its extensive network of fitness clubs, studios, and wellness services.

Founded in 1992, Life Time operates numerous facilities across North America, offering a wide range of fitness options, including personal training, group fitness classes, yoga, and specialized sports programs. The company’s mission is to inspire individuals to live healthier, happier lives through a holistic approach to health and fitness.
Life Time’s facilities are designed to provide a comprehensive experience for members, featuring state-of-the-art gym equipment, swimming pools, spa services, and cafes that offer healthy dining options. In addition to fitness facilities, Life Time offers various wellness programs, including nutrition coaching, health assessments, and lifestyle management services. The company also emphasizes family-oriented programs, providing kids’ activities, sports leagues, and educational workshops for all ages.
The main drivers of growth for Life Time Group include the increasing awareness of health and wellness among consumers, which has led to a rising demand for fitness services and facilities. As more people prioritize physical fitness and healthy living, Life Time’s comprehensive approach positions it well to capture this growing market. Additionally, the company’s focus on expanding its locations, enhancing member experiences, and introducing new wellness programs further supports its growth trajectory. The rise of corporate wellness initiatives and partnerships also presents new opportunities for Life Time to reach a broader audience. Learn more at Life Time Group Holdings, Inc..
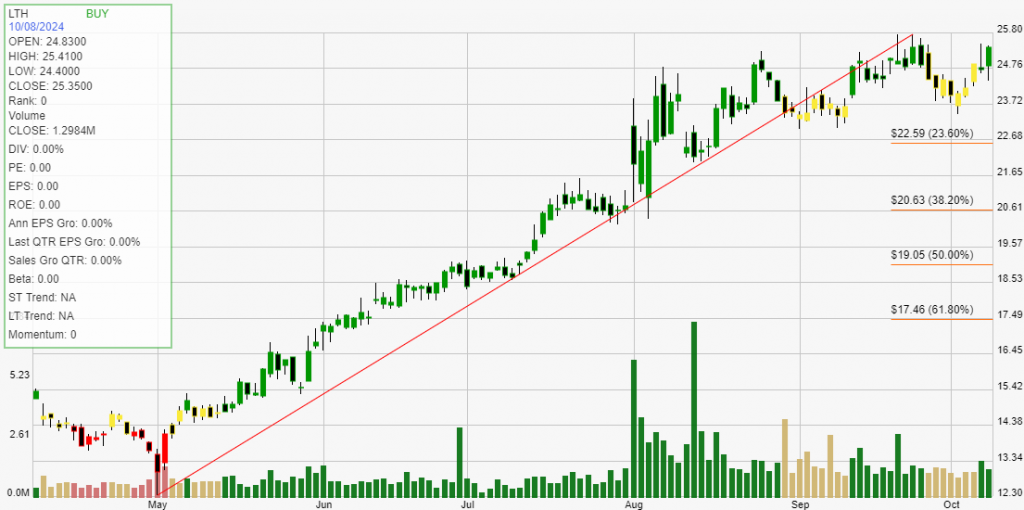
Click The Image For Current Live Chart
Backtesting a stock can provide investors with critical statistical data. These results give you an informed perspective on how a stock trades within your chosen buying and selling method of analysis. The definition of trade expectancy is defined as: trade expectancy = (probability of win * average win) – (probability of loss * average loss). If the calculation returns a positive number, a trader should make money over time.
The average percentage gained on positive, money making trades was 34.72%. While the average percent loss on money losing trades was 7.48%.
Trade expectancy includes both winners and losers. Trade expectancy is displayed as a percentage. This backtest displays the dollar value, percentage, annual trade expectancy, and annual percent. Annual expectancy is the trade expectancy percentage multiplied by the number of trades per year.
The Trade expectancy % for LTH over the past year is 20.65%. The number of trades generated per year was 3 giving an Annual Trade Expectancy of 61.96%
The average days in a trade is 45 and the average days between trades is 56.
With any method of analysis that uses past performance, it can be said that past performance is not indication of future performance. What is does provide is a probabilistic look at a stock’s price activity characteristics over time.