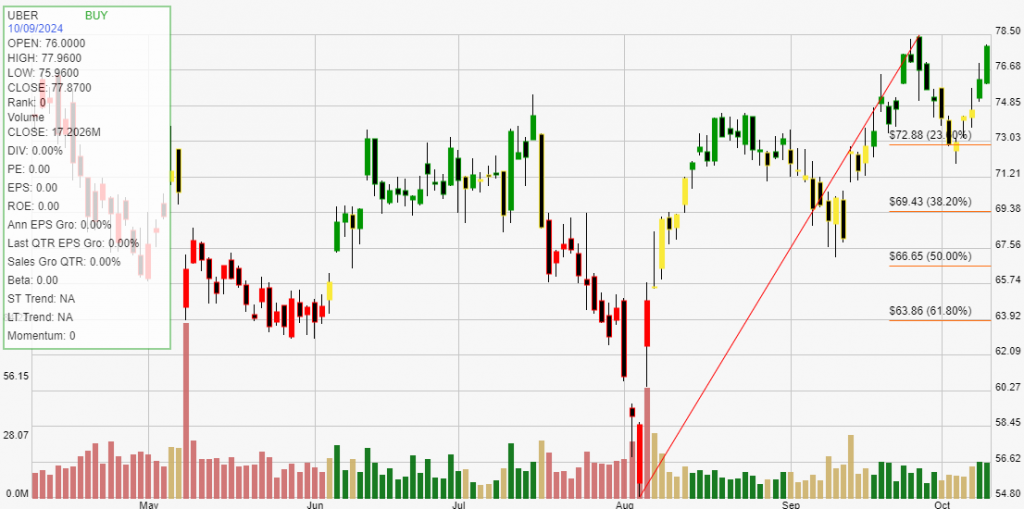
Uber Technologies, Inc. (UBER) is a leading technology company that has transformed the transportation industry through its innovative ride-hailing platform. Founded in 2009, Uber connects riders with drivers via a smartphone app, providing convenient and flexible transportation options in over 900 metropolitan areas worldwide.

Beyond ride-hailing, Uber has expanded its services to include food delivery through Uber Eats, freight transportation via Uber Freight, and other initiatives that leverage its technology to streamline various aspects of urban mobility.
Uber’s primary services include its ride-hailing platform, which allows users to book rides with just a few taps on their phones. The company offers several ride options, including UberX (standard rides), UberXL (larger vehicles), and premium services like Uber Comfort and Uber Lux. Additionally, Uber Eats enables users to order food from local restaurants and have it delivered to their doorstep. Uber Freight connects shippers with truck drivers, optimizing logistics and transportation for businesses.
The main drivers of growth for Uber include the increasing demand for convenient, on-demand transportation services as urbanization continues to rise. As more consumers prioritize flexibility and accessibility in their travel options, Uber’s platform is well-positioned to meet this demand. The company’s expansion into food delivery and logistics services also provides new revenue streams. Moreover, advancements in technology and the development of autonomous vehicles present additional opportunities for Uber to innovate and enhance its services in the future. Learn more at Uber Technologies, Inc..
Click The Image For Current Live Chart
Backtesting a stock can provide investors with critical statistical data. These results give you an informed perspective on how a stock trades within your chosen buying and selling method of analysis. The definition of trade expectancy is defined as: trade expectancy = (probability of win * average win) – (probability of loss * average loss). If the calculation returns a positive number, a trader should make money over time.
The average percentage gained on positive, money making trades was 35.79%. While the average percent loss on money losing trades was 3.08%.
Trade expectancy includes both winners and losers. Trade expectancy is displayed as a percentage. This backtest displays the dollar value, percentage, annual trade expectancy, and annual percent. Annual expectancy is the trade expectancy percentage multiplied by the number of trades per year.
The Trade expectancy % for UBER over the past year is 22.83%. The number of trades generated per year was 3 giving an Annual Trade Expectancy of 68.49%
The average days in a trade is 96 and the average days between trades is 67.
With any method of analysis that uses past performance, it can be said that past performance is not indication of future performance. What is does provide is a probabilistic look at a stock’s price activity characteristics over time.