Abercrombie & Fitch Co. (ANF) is a global retailer that specializes in casual luxury apparel for young adults and children. Founded in 1892, the company operates several well-known brands, including Abercrombie & Fitch, Abercrombie Kids, and Hollister Co. Known for its iconic styles, Abercrombie & Fitch focuses on offering high-quality clothing that reflects a casual, yet fashionable lifestyle. The brand is recognized for its distinctive marketing, store experiences, and emphasis on youth culture.

Abercrombie & Fitch’s product offerings include a wide range of apparel, including jeans, t-shirts, dresses, outerwear, and activewear, as well as accessories and personal care items. The company aims to create a lifestyle brand that resonates with consumers, emphasizing quality and craftsmanship in its products. Recent efforts have focused on expanding inclusivity in its sizing and marketing strategies, aiming to appeal to a broader customer base.
The main drivers of growth for Abercrombie & Fitch include the resurgence of demand for casual and athleisure wear, particularly among younger consumers. As trends continue to shift toward comfort and versatility in fashion, Abercrombie’s offerings are well-positioned to capitalize on this demand. Additionally, the company’s focus on e-commerce and digital marketing, as well as its commitment to sustainability and ethical sourcing, contribute to its growth strategy. By engaging with its target audience through social media and influencer partnerships, Abercrombie aims to strengthen its brand presence and drive sales. Learn more at Abercrombie & Fitch Co..
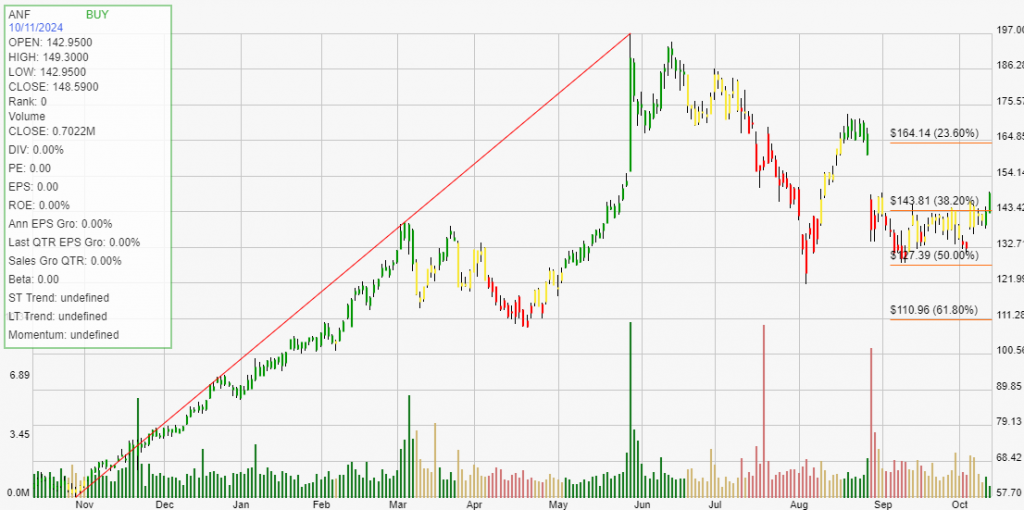
Click The Image For Current Live Chart
Backtesting a stock can provide investors with critical statistical data. These results give you an informed perspective on how a stock trades within your chosen buying and selling method of analysis. The definition of trade expectancy is defined as: trade expectancy = (probability of win * average win) – (probability of loss * average loss). If the calculation returns a positive number, a trader should make money over time.
The average percentage gained on positive, money making trades was 44.43%. While the average percent loss on money losing trades was 18.05%.
Trade expectancy includes both winners and losers. Trade expectancy is displayed as a percentage. This backtest displays the dollar value, percentage, annual trade expectancy, and annual percent. Annual expectancy is the trade expectancy percentage multiplied by the number of trades per year.
The Trade expectancy % for ANF over the past year is 28.81%. The number of trades generated per year was 4 giving an Annual Trade Expectancy of 115.25%
The average days in a trade is 83 and the average days between trades is 34.
With any method of analysis that uses past performance, it can be said that past performance is not indication of future performance. What is does provide is a probabilistic look at a stock’s price activity characteristics over time.