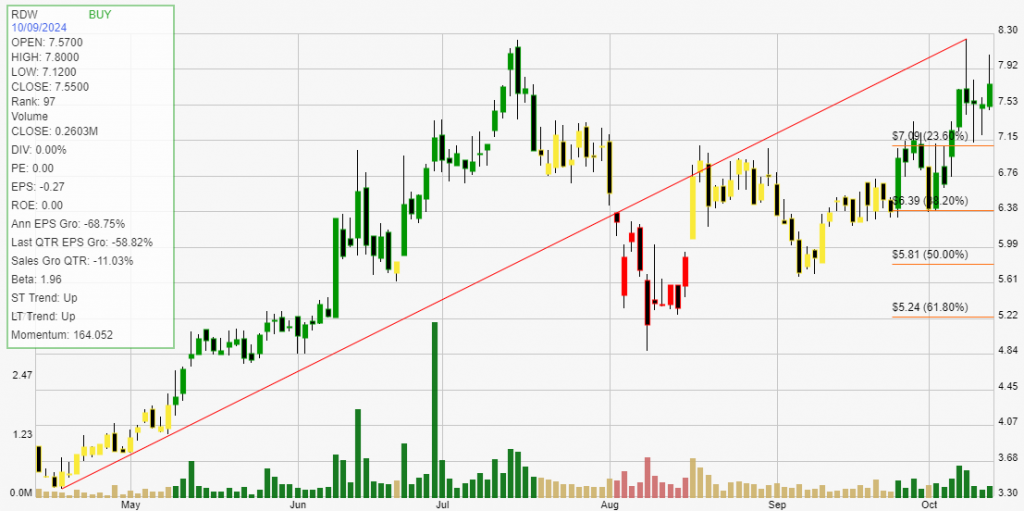
Redwire Corporation (RDW) is a prominent space infrastructure and services company focused on providing advanced technology solutions for the aerospace sector. Founded in 2020, Redwire specializes in developing and manufacturing space systems, components, and integrated solutions that support a variety of missions, including satellite deployment, space exploration, and advanced manufacturing in low Earth orbit (LEO). The company’s expertise encompasses a broad spectrum of capabilities, from spacecraft components to satellite services and lunar technologies.

Key offerings from Redwire include high-performance satellite components, advanced robotics for space applications, and in-space manufacturing solutions. The company is recognized for its innovative approach to developing modular spacecraft systems that can be customized for different missions, including those supporting NASA’s Artemis program for lunar exploration. Redwire also focuses on enhancing capabilities for commercial spaceflight and enabling sustainable operations in space.
The main drivers of growth for Redwire Corporation include the increasing demand for satellite services, the expansion of the commercial space industry, and the growing interest in space exploration initiatives. As more companies and government agencies invest in space technologies, Redwire’s advanced solutions position it well to capitalize on these trends. Additionally, partnerships with key players in the aerospace sector and investments in research and development enable Redwire to remain at the forefront of innovation in space infrastructure. Learn more at Redwire Corporation.
Click The Image For Current Live Chart
Backtesting a stock can provide investors with critical statistical data. These results give you an informed perspective on how a stock trades within your chosen buying and selling method of analysis. The definition of trade expectancy is defined as: trade expectancy = (probability of win * average win) – (probability of loss * average loss). If the calculation returns a positive number, a trader should make money over time.
The average percentage gained on positive, money making trades was 29.35%. While the average percent loss on money losing trades was 14.68%.
Trade expectancy includes both winners and losers. Trade expectancy is displayed as a percentage. This backtest displays the dollar value, percentage, annual trade expectancy, and annual percent. Annual expectancy is the trade expectancy percentage multiplied by the number of trades per year.
The Trade expectancy % for RDW over the past year is 18.35%. The number of trades generated per year was 4 giving an Annual Trade Expectancy of 73.38%
The average days in a trade is 75 and the average days between trades is 24.
With any method of analysis that uses past performance, it can be said that past performance is not indication of future performance. What is does provide is a probabilistic look at a stock’s price activity characteristics over time.