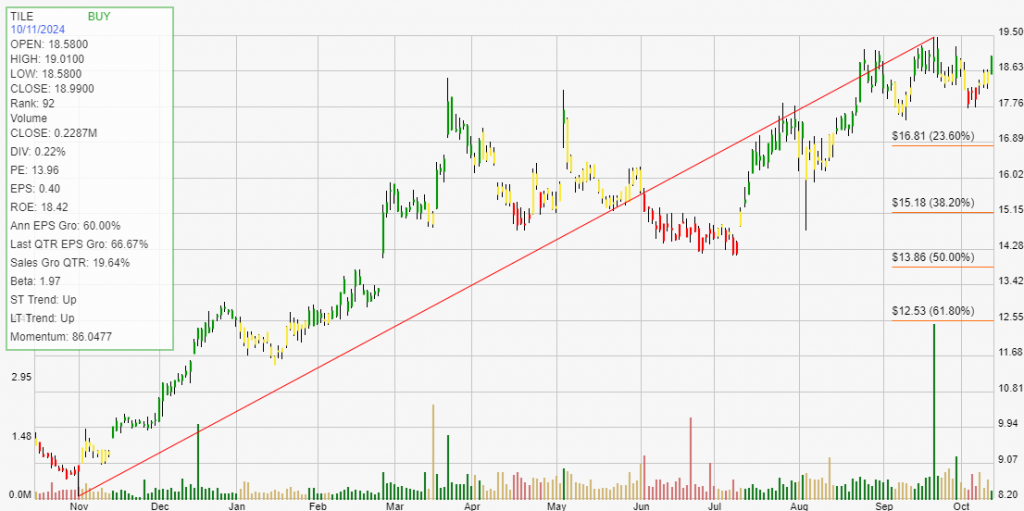
Interface, Inc. (TILE) is a global leader in the design and production of modular flooring products, primarily focused on carpet tiles and resilient flooring solutions. Founded in 1973, Interface has established itself as a pioneer in sustainable design and manufacturing, emphasizing environmental responsibility and innovation in its products. The company’s mission is to create beautiful and functional spaces while minimizing its impact on the planet through sustainable practices.

Interface offers a wide range of flooring solutions, including carpet tiles, luxury vinyl tile (LVT), and resilient flooring options. Their modular carpet tiles allow for easy installation, maintenance, and replacement, making them a preferred choice for commercial spaces, offices, and educational institutions. Interface is recognized for its commitment to sustainability, with many of its products being made from recycled materials and designed with a focus on reducing waste and energy consumption.
The main drivers of growth for Interface include the increasing demand for sustainable building materials, as more companies prioritize environmental responsibility in their operations. The rise of remote work and changes in workplace design have also spurred interest in modular flooring solutions that offer flexibility and adaptability. Additionally, Interface’s strategic focus on innovation, new product development, and expansion into international markets positions the company for continued growth in the competitive flooring industry. Learn more at Interface, Inc..
Click The Image For Current Live Chart
Backtesting a stock can provide investors with critical statistical data. These results give you an informed perspective on how a stock trades within your chosen buying and selling method of analysis. The definition of trade expectancy is defined as: trade expectancy = (probability of win * average win) – (probability of loss * average loss). If the calculation returns a positive number, a trader should make money over time.
The average percentage gained on positive, money making trades was 35.5%. While the average percent loss on money losing trades was 12.32%.
Trade expectancy includes both winners and losers. Trade expectancy is displayed as a percentage. This backtest displays the dollar value, percentage, annual trade expectancy, and annual percent. Annual expectancy is the trade expectancy percentage multiplied by the number of trades per year.
The Trade expectancy % for TILE over the past year is 19.56%. The number of trades generated per year was 3 giving an Annual Trade Expectancy of 58.67%
The average days in a trade is 92 and the average days between trades is 30.
With any method of analysis that uses past performance, it can be said that past performance is not indication of future performance. What is does provide is a probabilistic look at a stock’s price activity characteristics over time.