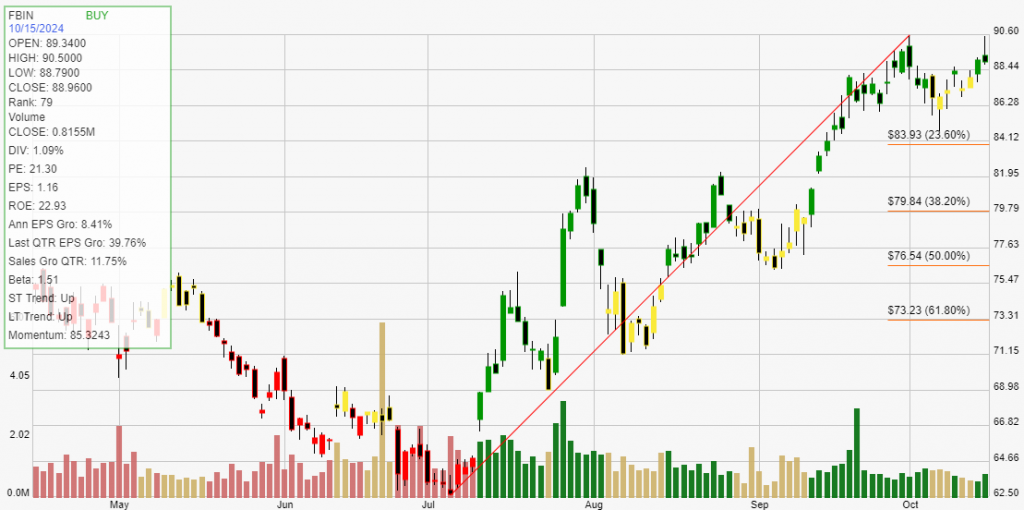
Fortune Brands Innovations, Inc. (FBIN) is a leading home and security products company known for its innovative and high-quality offerings. The company specializes in a diverse range of products that enhance both residential and commercial spaces, focusing on areas such as cabinetry, plumbing fixtures, doors, and windows.

With well-known brands like Moen, MasterLock, and Therma-Tru under its umbrella, Fortune Brands Innovations has established a strong presence in the home improvement market. Their commitment to quality, design, and functionality helps homeowners and builders alike create spaces that are not only beautiful but also highly functional.
The company’s growth strategy is driven by several key factors. One of the primary drivers is the ongoing demand for home renovation and improvement projects, which has seen a significant boost in recent years. As homeowners invest more in upgrading their living spaces, Fortune Brands Innovations is well-positioned to provide the necessary products.
Additionally, the company places a strong emphasis on innovation, continually developing new products that meet the evolving needs of consumers. By investing in research and development, Fortune Brands Innovations ensures that its offerings remain competitive and relevant in a rapidly changing market.
Furthermore, Fortune Brands Innovations is committed to sustainability and responsible sourcing, which resonates well with today’s environmentally conscious consumers. Their focus on energy-efficient and eco-friendly products not only enhances their brand reputation but also meets the increasing consumer demand for sustainable options. Overall, Fortune Brands Innovations, Inc. is well-equipped to capitalize on market trends and drive growth through its commitment to innovation, quality, and sustainability.
Click The Image For Current Live Chart
Backtesting a stock can provide investors with critical statistical data. These results give you an informed perspective on how a stock trades within your chosen buying and selling method of analysis. The definition of trade expectancy is defined as: trade expectancy = (probability of win * average win) – (probability of loss * average loss). If the calculation returns a positive number, a trader should make money over time.
The average percentage gained on positive, money making trades was 27.92%. While the average percent loss on money losing trades was 0.00%.
Trade expectancy includes both winners and losers. Trade expectancy is displayed as a percentage. This backtest displays the dollar value, percentage, annual trade expectancy, and annual percent. Annual expectancy is the trade expectancy percentage multiplied by the number of trades per year.
The Trade expectancy % for FBIN over the past year is 27.92%. The number of trades generated per year was 2 giving an Annual Trade Expectancy of 55.84%
The average days in a trade is 156 and the average days between trades is 0.
With any method of analysis that uses past performance, it can be said that past performance is not indication of future performance. What is does provide is a probabilistic look at a stock’s price activity characteristics over time.