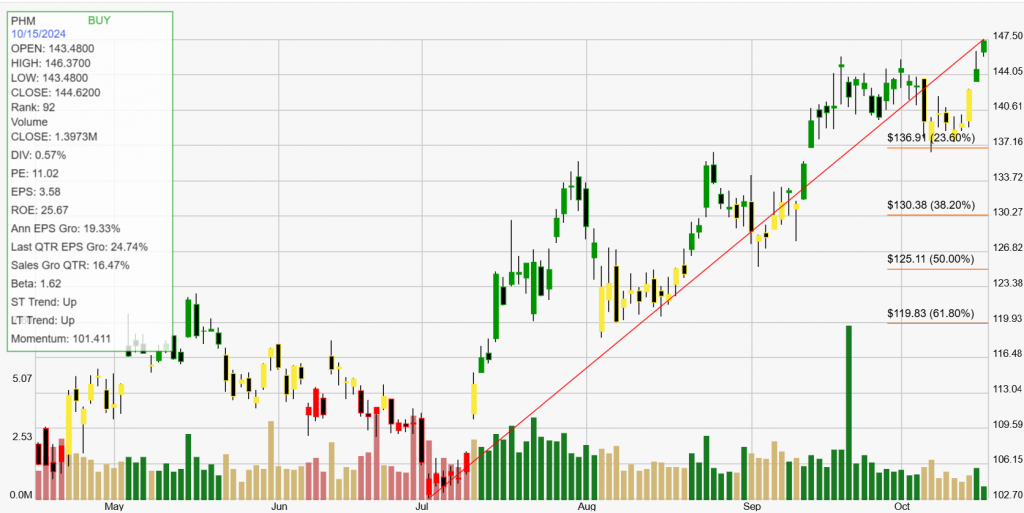
PulteGroup, Inc. (PHM) is one of the largest homebuilding companies in the United States, focusing on the development of residential communities across the country. The company is known for its commitment to quality construction and innovative design, providing a range of homes that cater to various buyer preferences and budgets. PulteGroup operates several well-known brands, including Pulte Homes, Centex, and Del Webb, each targeting different segments of the housing market. Their offerings include single-family homes, townhomes, and active adult communities, allowing them to serve a diverse customer base.
The growth of PulteGroup is driven by several key factors. First and foremost, the ongoing demand for new housing continues to be strong, fueled by favorable demographic trends and low-interest rates. As millennials enter the housing market and baby boomers look to downsize, PulteGroup is well-positioned to meet the evolving needs of these buyers. Additionally, the company focuses on sustainable building practices, which appeal to environmentally conscious consumers. By incorporating energy-efficient designs and materials into their homes, PulteGroup not only enhances the appeal of their products but also contributes to a more sustainable future.
PulteGroup’s strategic land acquisition and development plans also play a crucial role in their growth strategy. The company seeks out prime locations for new developments, ensuring that they can provide desirable communities in key markets. Their commitment to customer satisfaction, combined with innovative home designs and a focus on community building, positions PulteGroup for continued success in the competitive homebuilding industry. As the demand for housing remains strong, PulteGroup is well-equipped to capitalize on emerging opportunities in the market.
Click The Image For Current Live ChartBacktesting a stock can provide investors with critical statistical data. These results give you an informed perspective on how a stock trades within your chosen buying and selling method of analysis. The definition of trade expectancy is defined as: trade expectancy = (probability of win * average win) – (probability of loss * average loss). If the calculation returns a positive number, a trader should make money over time.
The average percentage gained on positive, money making trades was 19.95%. While the average percent loss on money losing trades was 6.27%.
Trade expectancy includes both winners and losers. Trade expectancy is displayed as a percentage. This backtest displays the dollar value, percentage, annual trade expectancy, and annual percent. Annual expectancy is the trade expectancy percentage multiplied by the number of trades per year.
The Trade expectancy % for PHM over the past year is 13.4%. The number of trades generated per year was 4 giving an Annual Trade Expectancy of 53.59%
The average days in a trade is 61 and the average days between trades is 19.
With any method of analysis that uses past performance, it can be said that past performance is not indication of future performance. What is does provide is a probabilistic look at a stock’s price activity characteristics over time.

