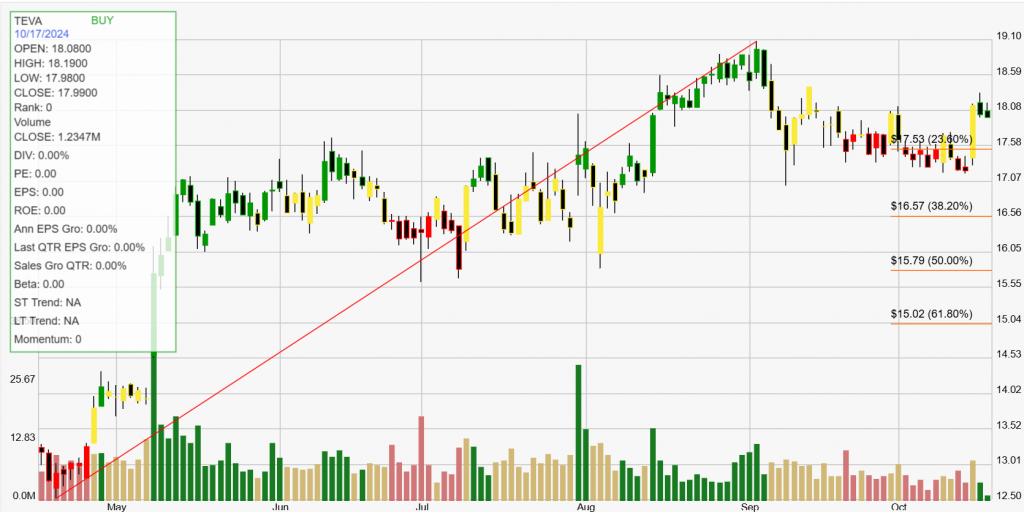
Teva Pharmaceutical Industries Limited (TEVA) is a global leader in the pharmaceutical industry, known primarily for its production of generic and specialty medications. Headquartered in Israel, Teva operates in over 60 countries and offers a wide range of products, including generic drugs, over-the-counter medications, and specialty pharmaceuticals. The company has a robust portfolio of more than 3,500 products, making it one of the largest generic drug manufacturers in the world. Teva is particularly well-known for its expertise in complex generics and biosimilars, which are biologic medical products highly similar to already approved reference products.
Teva’s growth strategy is driven by several key factors. The increasing demand for affordable healthcare solutions continues to propel the market for generic medications, as patients and healthcare providers seek cost-effective alternatives to branded drugs. Teva’s strong global presence allows it to capitalize on this demand by providing a diverse range of products tailored to different markets. Additionally, the company’s focus on research and development helps it innovate and expand its specialty pharmaceutical offerings, particularly in therapeutic areas like central nervous system disorders, oncology, and respiratory diseases.
Moreover, Teva is committed to enhancing patient access to its medications through various initiatives, including patient support programs and partnerships with healthcare providers. The company also emphasizes sustainability and corporate responsibility, aiming to reduce its environmental impact and improve global health outcomes. With its strong product pipeline and commitment to affordability and innovation, Teva Pharmaceutical Industries is well-positioned for continued success in the ever-evolving pharmaceutical landscape.
Click The Image For Current Live ChartBacktesting a stock can provide investors with critical statistical data. These results give you an informed perspective on how a stock trades within your chosen buying and selling method of analysis. The definition of trade expectancy is defined as: trade expectancy = (probability of win * average win) – (probability of loss * average loss). If the calculation returns a positive number, a trader should make money over time.
The average percentage gained on positive, money making trades was 23.42%. While the average percent loss on money losing trades was 0.72%.
Trade expectancy includes both winners and losers. Trade expectancy is displayed as a percentage. This backtest displays the dollar value, percentage, annual trade expectancy, and annual percent. Annual expectancy is the trade expectancy percentage multiplied by the number of trades per year.
The Trade expectancy % for TEVA over the past year is 17.38%. The number of trades generated per year was 4 giving an Annual Trade Expectancy of 69.54%
The average days in a trade is 92 and the average days between trades is 16.
With any method of analysis that uses past performance, it can be said that past performance is not indication of future performance. What is does provide is a probabilistic look at a stock’s price activity characteristics over time.

