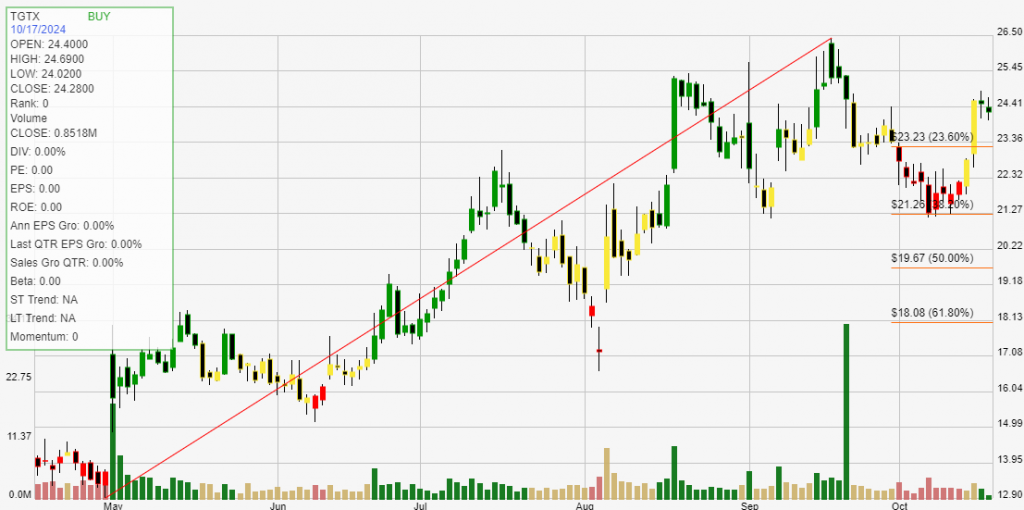
TG Therapeutics, Inc. (TGTX) is a biotechnology company focused on developing innovative therapies for the treatment of B-cell diseases, including various forms of cancer and autoimmune disorders. Founded in 2012, the company is committed to advancing the treatment landscape through the development of novel, targeted therapies that aim to improve patient outcomes. TG Therapeutics is particularly known for its research in the areas of multiple sclerosis (MS) and hematological malignancies, with a focus on monoclonal antibody treatments.

One of the company’s lead product candidates is ublituximab, a next-generation monoclonal antibody that targets CD20, a protein found on the surface of B cells. Ublituximab is being evaluated for its effectiveness in treating chronic lymphocytic leukemia (CLL) and relapsing forms of multiple sclerosis. TG Therapeutics is also developing TG-1101, a combination therapy that pairs ublituximab with other treatments to enhance efficacy against B-cell malignancies.
The main drivers of growth for TG Therapeutics include the increasing prevalence of B-cell-related diseases and the demand for more effective treatment options. As healthcare providers and patients seek better therapies, TG Therapeutics’ innovative approach positions it well to capture market share in these specialized therapeutic areas. Additionally, the company’s commitment to clinical research and strategic collaborations with academic and pharmaceutical partners enhances its ability to bring new treatments to market and expand its product pipeline.
Click The Image For Current Live Chart
Backtesting a stock can provide investors with critical statistical data. These results give you an informed perspective on how a stock trades within your chosen buying and selling method of analysis. The definition of trade expectancy is defined as: trade expectancy = (probability of win * average win) – (probability of loss * average loss). If the calculation returns a positive number, a trader should make money over time.
The average percentage gained on positive, money making trades was 26.99%. While the average percent loss on money losing trades was 5.59%.
Trade expectancy includes both winners and losers. Trade expectancy is displayed as a percentage. This backtest displays the dollar value, percentage, annual trade expectancy, and annual percent. Annual expectancy is the trade expectancy percentage multiplied by the number of trades per year.
The Trade expectancy % for TGTX over the past year is 5.27%. The number of trades generated per year was 5 giving an Annual Trade Expectancy of 26.35%
The average days in a trade is 48 and the average days between trades is 24.
With any method of analysis that uses past performance, it can be said that past performance is not indication of future performance. What is does provide is a probabilistic look at a stock’s price activity characteristics over time.