Boot Barn Holdings, Inc. (BOOT) is a leading retailer of western and work-related footwear, apparel, and accessories in the United States. Founded in 1978, the company has established itself as a go-to destination for customers seeking authentic western-style products, ranging from cowboy boots to workwear. Boot Barn operates a network of stores across the country, as well as a robust online presence, allowing customers to shop conveniently for their favorite brands. The company offers a wide variety of products, including well-known brands like Justin, Ariat, and Lucchese, appealing to a diverse customer base that includes ranchers, outdoor enthusiasts, and fashion-conscious shoppers.
The growth of Boot Barn is driven by several key factors. One significant aspect is the increasing popularity of western and workwear fashion, which has expanded beyond traditional markets and attracted a broader audience. This trend has been further amplified by social media and celebrity endorsements that highlight western fashion’s appeal. Boot Barn has effectively leveraged this trend by enhancing its product offerings and marketing efforts, ensuring that it remains relevant in a competitive retail environment.
Additionally, Boot Barn focuses on expanding its store footprint, strategically opening new locations in high-potential markets. This growth strategy not only increases brand visibility but also allows the company to reach new customers who may not have had access to their products before. The company’s commitment to providing exceptional customer service and fostering a strong community connection has also contributed to customer loyalty. Overall, Boot Barn Holdings, Inc. is well-positioned for continued growth as it capitalizes on emerging fashion trends and expands its reach in the retail market.
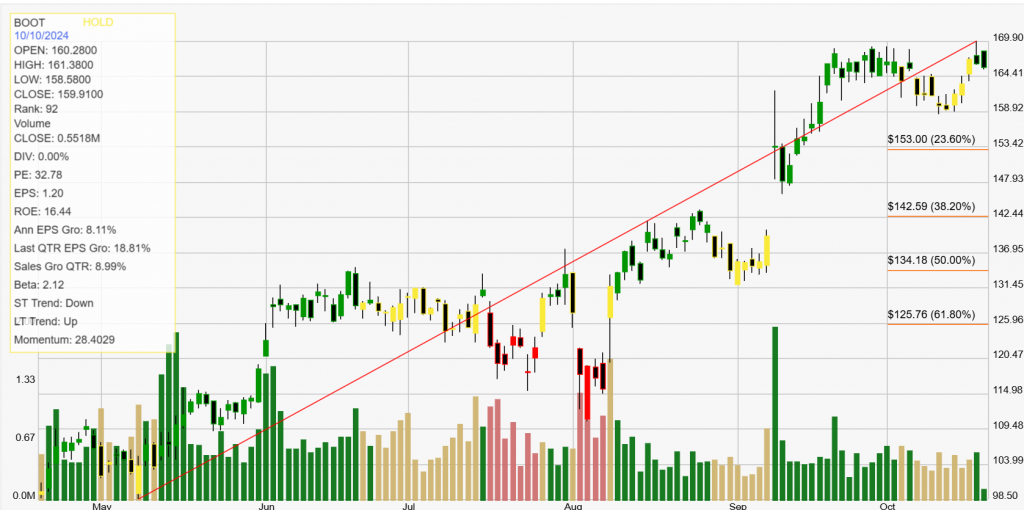
Click The Image For Current Live ChartBacktesting a stock can provide investors with critical statistical data. These results give you an informed perspective on how a stock trades within your chosen buying and selling method of analysis. The definition of trade expectancy is defined as: trade expectancy = (probability of win * average win) – (probability of loss * average loss). If the calculation returns a positive number, a trader should make money over time.
The average percentage gained on positive, money making trades was 19.57%. While the average percent loss on money losing trades was 10.81%.
Trade expectancy includes both winners and losers. Trade expectancy is displayed as a percentage. This backtest displays the dollar value, percentage, annual trade expectancy, and annual percent. Annual expectancy is the trade expectancy percentage multiplied by the number of trades per year.
The Trade expectancy % for BOOT over the past year is 7.42%. The number of trades generated per year was 4 giving an Annual Trade Expectancy of 29.66%
The average days in a trade is 48 and the average days between trades is 18.
With any method of analysis that uses past performance, it can be said that past performance is not indication of future performance. What is does provide is a probabilistic look at a stock’s price activity characteristics over time.

