AST SpaceMobile, Inc. (ASTS) is an innovative telecommunications company focused on building the world’s first space-based cellular broadband network. Founded in 2017, AST SpaceMobile aims to provide mobile connectivity to underserved and remote areas by leveraging a constellation of low Earth orbit (LEO) satellites. The company’s mission is to ensure that everyone, regardless of their location, has access to high-speed mobile broadband services.

AST SpaceMobile‘s unique approach involves integrating its satellite technology with existing cellular networks, allowing users to connect directly to satellites using standard mobile phones. This capability has the potential to revolutionize connectivity, especially in regions where traditional infrastructure is limited or nonexistent. The company is currently in the process of launching its satellite constellation and conducting tests to demonstrate its technology’s effectiveness.
The main drivers of growth for AST SpaceMobile include the increasing demand for global connectivity, particularly in remote and rural areas. As mobile data consumption continues to rise, the need for reliable broadband services becomes more critical. Additionally, the global push for digital inclusion and improved access to communication services presents significant opportunities for AST SpaceMobile. The company’s strategic partnerships with telecommunications providers further enhance its potential to scale its services and reach a wider audience. Learn more at AST SpaceMobile, Inc..
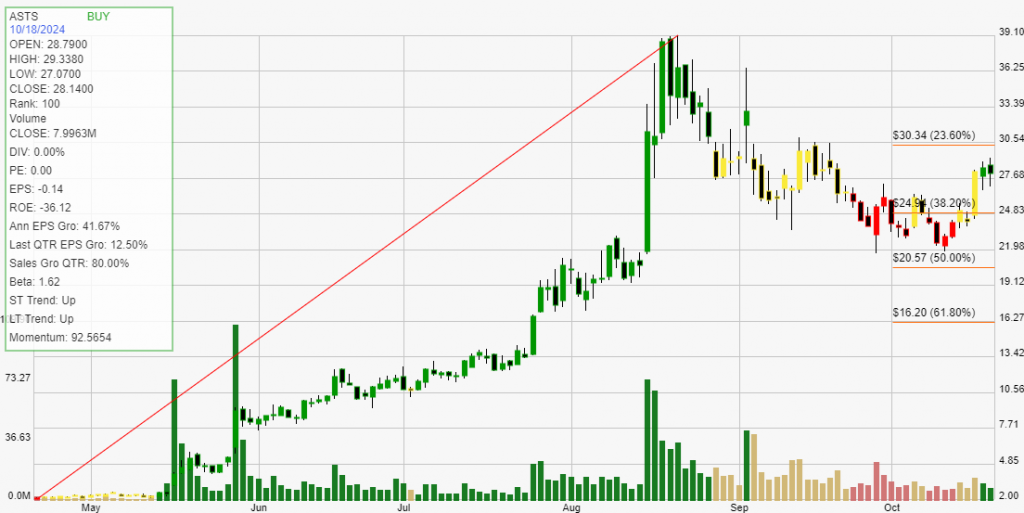
Click The Image For Current Live Chart
Backtesting a stock can provide investors with critical statistical data. These results give you an informed perspective on how a stock trades within your chosen buying and selling method of analysis. The definition of trade expectancy is defined as: trade expectancy = (probability of win * average win) – (probability of loss * average loss). If the calculation returns a positive number, a trader should make money over time.
The average percentage gained on positive, money making trades was 452.23%. While the average percent loss on money losing trades was 2.26%.
Trade expectancy includes both winners and losers. Trade expectancy is displayed as a percentage. This backtest displays the dollar value, percentage, annual trade expectancy, and annual percent. Annual expectancy is the trade expectancy percentage multiplied by the number of trades per year.
The Trade expectancy % for ASTS over the past year is 300.73%. The number of trades generated per year was 3 giving an Annual Trade Expectancy of 902.19%
The average days in a trade is 102 and the average days between trades is 124.
With any method of analysis that uses past performance, it can be said that past performance is not indication of future performance. What is does provide is a probabilistic look at a stock’s price activity characteristics over time.