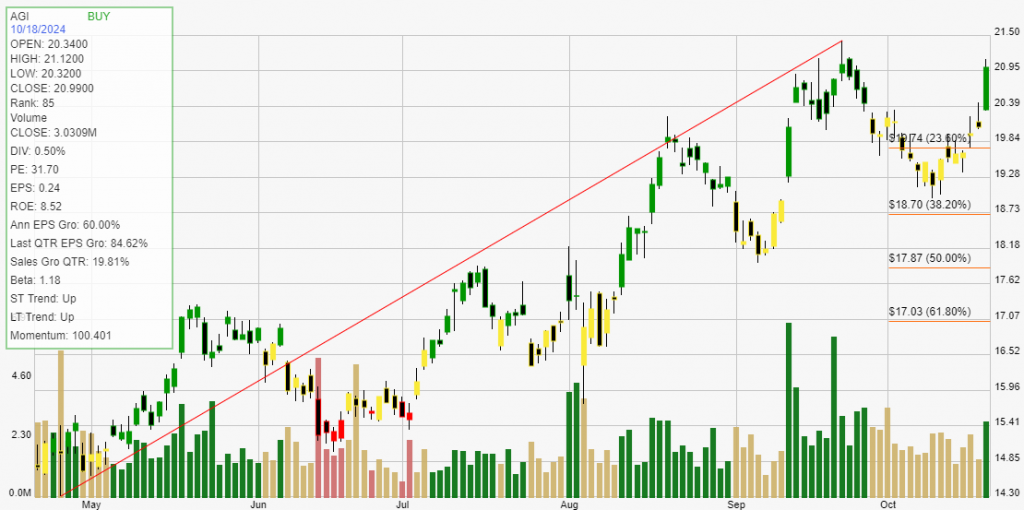
Alamos Gold Inc. (AGI) is a Canadian-based gold mining company that focuses on the acquisition, exploration, and development of mineral properties in North America. Founded in 2003, Alamos Gold has established itself as a reliable producer of gold, with operations primarily in Canada and Mexico.

The company’s mission is to create long-term value for its shareholders by developing high-quality gold assets and practicing sustainable mining. Alamos Gold operates several key assets, including the Young-Davidson and Island Gold mines in Ontario, Canada, as well as the Mulatos mine in Sonora, Mexico.
The company is known for its commitment to responsible mining practices, prioritizing environmental stewardship, community engagement, and safety throughout its operations. Alamos Gold’s exploration efforts focus on expanding its existing resources and discovering new gold deposits, which enhances its growth potential and ensures a steady pipeline of projects.
The main drivers of growth for Alamos Gold include the increasing global demand for gold, particularly as a safe-haven asset during economic uncertainty. With rising gold prices, the company is well-positioned to capitalize on its established operations and ongoing exploration initiatives.
Additionally, Alamos Gold’s commitment to operational efficiency and cost management enables it to maintain profitability even in fluctuating market conditions. The company’s strategic focus on sustainability and community relations also enhances its reputation and supports long-term success. Learn more at Alamos Gold Inc..
Click The Image For Current Live Chart
Backtesting a stock can provide investors with critical statistical data. These results give you an informed perspective on how a stock trades within your chosen buying and selling method of analysis. The definition of trade expectancy is defined as: trade expectancy = (probability of win * average win) – (probability of loss * average loss). If the calculation returns a positive number, a trader should make money over time.
The average percentage gained on positive, money making trades was 16.5%. While the average percent loss on money losing trades was 0.00%.
Trade expectancy includes both winners and losers. Trade expectancy is displayed as a percentage. This backtest displays the dollar value, percentage, annual trade expectancy, and annual percent. Annual expectancy is the trade expectancy percentage multiplied by the number of trades per year.
The Trade expectancy % for AGI over the past year is 16.5%. The number of trades generated per year was 3 giving an Annual Trade Expectancy of 49.51%
The average days in a trade is 86 and the average days between trades is 63.
With any method of analysis that uses past performance, it can be said that past performance is not indication of future performance. What is does provide is a probabilistic look at a stock’s price activity characteristics over time.