Flexsteel Industries, Inc. (FLXS) is a well-established manufacturer and retailer of upholstered and wooden furniture, primarily serving the residential and commercial markets in the United States. Founded in 1893 and headquartered in Dubuque, Iowa, Flexsteel is known for its commitment to quality craftsmanship, innovative design, and durable products. The company offers a wide range of furniture, including sofas, chairs, and recliners, as well as custom and modular furniture solutions.

Flexsteel’s product offerings are designed to meet the diverse needs of its customers, with an emphasis on comfort, style, and functionality. The company markets its products under various brand names, including Flexsteel, C2C (Cut to Care), and the Camo brand, catering to different segments of the furniture market. Flexsteel’s dedication to sustainability is evident in its use of environmentally responsible materials and manufacturing practices, aligning with the growing consumer preference for eco-friendly products.
The main drivers of growth for Flexsteel include the increasing demand for home and office furniture as more people invest in their living and working spaces. The company’s focus on innovation and design enables it to respond to changing consumer preferences, particularly in the wake of the COVID-19 pandemic, which has shifted many consumers’ priorities toward home comfort and functionality. Additionally, Flexsteel’s strategic partnerships with retailers and distributors enhance its market reach, allowing the company to capture opportunities in both the residential and commercial furniture sectors. Learn more at Flexsteel Industries, Inc..
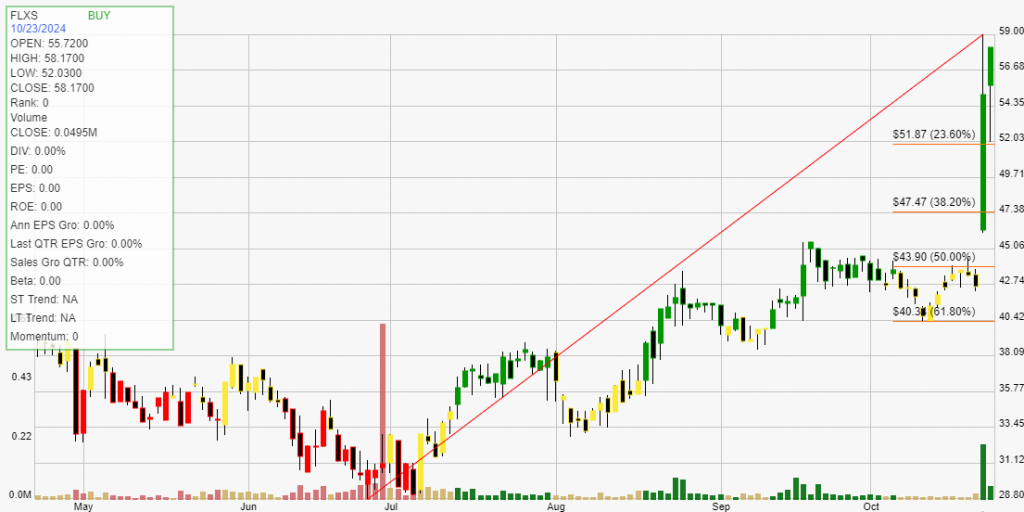
Click The Image For Current Live Chart
Backtesting a stock can provide investors with critical statistical data. These results give you an informed perspective on how a stock trades within your chosen buying and selling method of analysis. The definition of trade expectancy is defined as: trade expectancy = (probability of win * average win) – (probability of loss * average loss). If the calculation returns a positive number, a trader should make money over time.
The average percentage gained on positive, money making trades was 70.07%. While the average percent loss on money losing trades was 5.83%.
Trade expectancy includes both winners and losers. Trade expectancy is displayed as a percentage. This backtest displays the dollar value, percentage, annual trade expectancy, and annual percent. Annual expectancy is the trade expectancy percentage multiplied by the number of trades per year.
The Trade expectancy % for FLXS over the past year is 44.77%. The number of trades generated per year was 3 giving an Annual Trade Expectancy of 134.3%
The average days in a trade is 69 and the average days between trades is 5.
With any method of analysis that uses past performance, it can be said that past performance is not indication of future performance. What is does provide is a probabilistic look at a stock’s price activity characteristics over time.