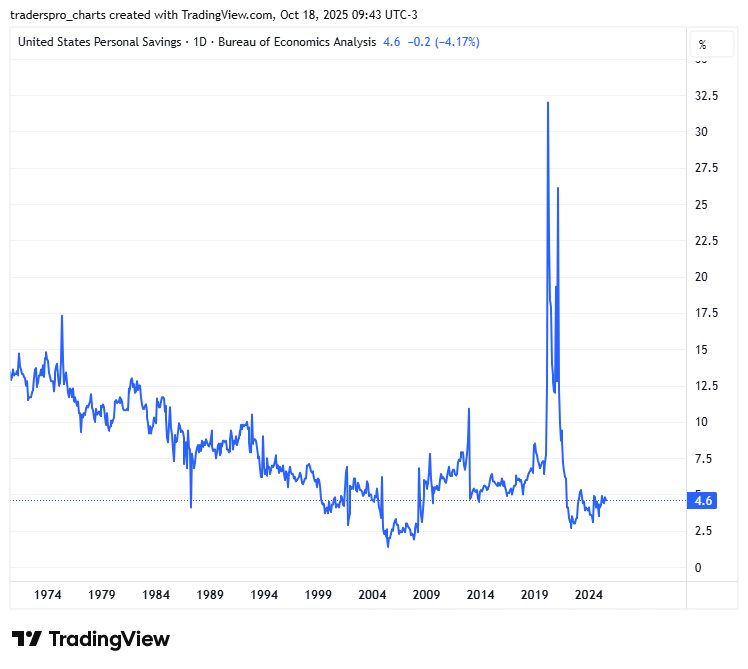
The chart below shows United States Personal Savings Rate data — the percentage of disposable income that Americans save rather than spend. It’s published by the Bureau of Economic Analysis (BEA) and gives a long-term look (from the early 1970s to 2025) at how much households set aside for the future. The latest reading is 4.6%, down 4.17% from the previous report.
Historical context
From the 1970s through the early 1980s, the U.S. personal savings rate typically hovered around 10–12%, reflecting an era of slower credit expansion, fewer borrowing options, and a cultural focus on thrift. As consumer credit markets matured through the 1980s and 1990s—credit cards, mortgages, and car loans became more accessible—saving steadily declined. By the mid-2000s, just before the financial crisis, savings fell to around 2–3%, one of the lowest levels on record.
After the 2008 financial crisis, savings rose temporarily as households paid down debt and cut spending. But the real anomaly came in 2020, when COVID stimulus payments and limited spending opportunities caused a massive spike — savings briefly soared above 30%, the highest in modern history. That surge quickly reversed once stimulus faded and inflation surged. By 2023–2025, savings had returned to pre-pandemic lows around 4–5%.
What it means for U.S. consumers now
A 4.6% savings rate signals that most households are stretched thin. Real wages (after inflation) have stagnated, and many families are spending nearly everything they earn on essentials: housing, food, insurance, and debt service. With credit-card balances at record highs and emergency savings depleted, many Americans are living paycheck to paycheck.
This low savings rate also reflects rising costs outpacing income growth—especially in rent, healthcare, and insurance premiums. It means fewer safety nets for emergencies, lower future investment, and greater reliance on borrowing to sustain consumption.
Economic implications going forward
When savings are low, consumer vulnerability rises. The U.S. economy is built on consumption—roughly 70% of GDP depends on it. So as savings thin out, people may soon be forced to cut discretionary spending, slowing retail and service activity.
In the short term, strong employment and wage growth can mask these risks, but if job growth weakens or credit tightens further, consumer demand could drop sharply. This is where the stock market and economy intersect: lower consumer spending often translates into weaker corporate earnings, pressuring equities.
At the same time, low savings constrain the Fed’s room to maneuver. If consumers can’t absorb higher interest costs or new debt, policy tightening quickly bites. Conversely, if rates fall, Americans might use that relief to rebuild some cushion—but that takes time.
The bottom line
The personal savings rate at 4.6% tells a story of an economy running on fumes. Households are still spending, but increasingly through borrowing rather than earning. If employment stays solid and inflation cools, the economy could glide along—what economists call a “soft landing.” But if layoffs rise or credit stress builds, the lack of savings could magnify any downturn.
This quiet number—the savings rate—is one of the most important warning lights on the consumer dashboard. Historically, when it stays low for too long, it signals that the next phase of the economic cycle is near.
Follow Trade Ideas on 
Trade Of The Day
The stock trade of the day provides you a leading stock that is trending in the current market environment.
[Get The Trade]
Market Trends
Understanding the overall market trend is the foundation of smart trading. Why? Because 85% of all stocks tend to move in the same direction as the broader market.
[Get the Report]
GET OUR FREE DAILY STOCK PICK NEWSLETTER
Follow Trade Ideas on