This week, I’ve been turning my focus to Healthcare stocks, most particularly to the Healthcare Equipment industry of that sector. The most-established stocks in the industry all seem to be at or very near to all-time high levels – something that I believe is driven by broad fundamental strength among most of these companies as well as institutional interest in a sector and industry that may be better suited to succeed under current market and economic conditions than most others.
It takes a bit of a mindset shift for me to consider stocks that most analysts would correctly describe as strong growth stocks, with a long pattern of bullish momentum, as potential value plays. Focusing on value requires a bit of a contrarian preference, which makes these kinds of stock pretty counter-intuitive. Stocks trading at or near all-time lows, but that have solid fundamental strength tend to be an easier fit. That said, it is also true that even stocks in long, extended bullish trends can still offer interesting value opportunities if the conditions are right.
Stryker Corp (SYK) is one of the more interesting Healthcare Equipment companies I’ve evaluated so far this week. The stock’s bullish performance is very strong – it is up nearly 40% year to date, and only a few dollars below its all-time high, which was set at the beginning of this week. Whether or not the stock is overvalued, or actually has an interesting value proposition to consider, depends a bit on what metrics you prefer to focus. Let’s run the numbers, and I’ll let you decide.
Fundamental and Value Profile
Stryker Corporation is a medical technology company. The Company offers a range of medical technologies, including orthopedic, medical and surgical, and neurotechnology and spine products. The Company’s segments include Orthopaedics; MedSurg; Neurotechnology and Spine, and Corporate and Other. The Orthopaedics segment includes reconstructive (hip and knee) and trauma implant systems and other related products. The MedSurg segment includes surgical equipment and surgical navigation systems; endoscopic and communications systems; patient handling, emergency medical equipment, intensive care disposable products; reprocessed and remanufactured medical devices, and other related products. The Neurotechnology and Spine segment includes neurovascular products, spinal implant systems and other related products. The Company’s products include implants, which are used in joint replacement and trauma surgeries, and other products that are used in a range of medical specialties. SYK has a current market cap of $81.9 billion.
Earnings and Sales Growth: Over the last twelve months, earnings grew by 12.5%, while sales increased nearly 10%. In the last quarter, earnings improved by 5.32% while Revenues increased about 3.81%. These aren’t astonishing numbers, and it is also true that being able to consistently grow earnings faster than sales generally isn’t sustainable in the long term; but it is also difficult even for extremely well-run companies to do this on a consistent basis. That makes this pattern very interesting, and is a strong indication of strength. SYK’s Net Income versus Revenue is healthy, despite showing signs of erosion in its operating margins, as Net Income as a percentage of Revenues dropped from an impressive 24.9% in the last twelve months to 13.15% in the last quarter.
Free Cash Flow: SYK’s Free Cash Flow is modest, but healthy at $1.9 billion. That translates to a Free Cash Flow Yield of 2.33%. It is also growing nicely; at the beginning of 2018, SYK’s free cash flow was $1.1 billion, so this is an improving number that lends credence to the quality of the stock’s positive earnings growth pattern. Contrasted against the declining Net Income pattern, however, I would be interested to see if this number can continue to improve in the quarters ahead to provide even more confirmation of the company’s strengthening fundamentals.
Debt to Equity: SYK has a debt/equity ratio of .67, which is pretty conservative. SYK’s balance sheet shows $1.8 billion in cash and liquid assets versus about $7.9 billion in long-term debt. Their operating profile, despite its decline in the last quarter suggests that operating margins are more than adequate to service their debt, with good liquidity to draw on if needed as well.
Dividend: SYK pays an annual dividend of $2.08 per share, which translates to a yield of a little under 1%. More remarkable is the fact that their dividend payout is modest – at less than 50% of earnings per share, along with a consistent pattern of raising its dividend per share over the last eight years, with no cuts.
Price/Book Ratio: there are a lot of ways to measure how much a stock should be worth; but one of the simplest methods that I like uses the stock’s Book Value, which for SYK is $31.92 per share. At the stock’s current price, that translates to a Price/Book Ratio of 6.86, which seems high against a historical average of 4.9, which puts the stock’s “fair” value at about $156 per share. That’s about -28.5% away from the stock’s current price, which certainly marks the stock as overvalued; however the stock is also trading about 30% below its historical Price/Cash Flow ratio, which offers a long-term target price at nearly $285 per share. Which should you believe? I prefer to see the Price/Book and Price/Cash Flow ratio both below their respective averages to validate an undervalued status under the best circumstances; but I think SYK offers an interesting argument to consider the Price/Cash Flow ratio as the more useful metric in this case.
Technical Profile
Here’s a look at the stock’s latest technical chart.
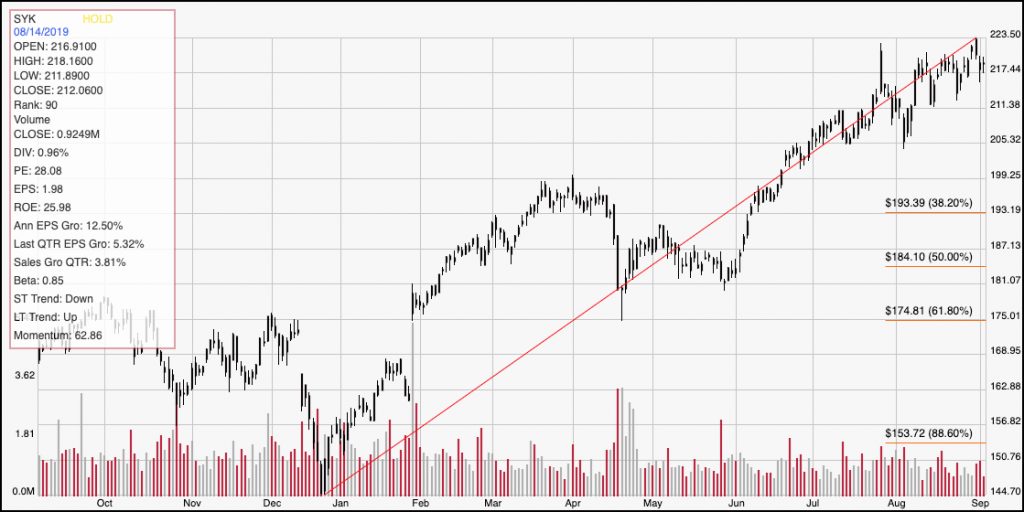
Current Price Action/Trends and Pivots: The red diagonal line traces the stock’s strong upward trend from December of 2018 to its all-time high around $223.50, reached just a few days ago. It also provides the base line for the Fibonacci retracement lines shown on the right side of the chart. The stock’s upward trend has really picked up steam since the beginning of June, with the stock current showing strong support in the $217 price area – just a couple of dollars below the stock’s current price – and immediate resistance at its recent peak at $223.50. How far might the stock go if it can break above that resistance? That’s a bit of a guess, no matter how you prefer to think about your analysis; but when you use the stock push above its last significant resistance gave it momentum to run from about $211 to $223.50, there is a case to make for a short-term bullish target at around $235. If, however, the stock drops below current support at $217, that previous resistance at $211 offers up the most likely next support level.
Near-term Keys: SYK’s fundamentals are among the strongest of the Healthcare Equipment stock’s I’ve considered so far this week. The question of value is in the eye of the beholder, but the stock’s next earnings report is due in the latter part of October. If the numbers I outlined earlier – Free Cash Flow and earnings and sales growth, for example – continue to show improvement, and the company’s pattern of Net Income improves, I would be even more inclined to consider SYK as a valid value opportunity than I am now. If you prefer to work short-term trading strategies, treat a break above $223.50 as a good sign to consider buying the stock or working with call options, with a bullish target within the next couple of months in the $235 range. If the stock breaks down below $217, it could offer an interesting opportunity to think about shorting the stock, or buying put options with an eye on support around $211 as the target price to close a bearish trade.